

【BTCJPY】20180723 Daily Pivot
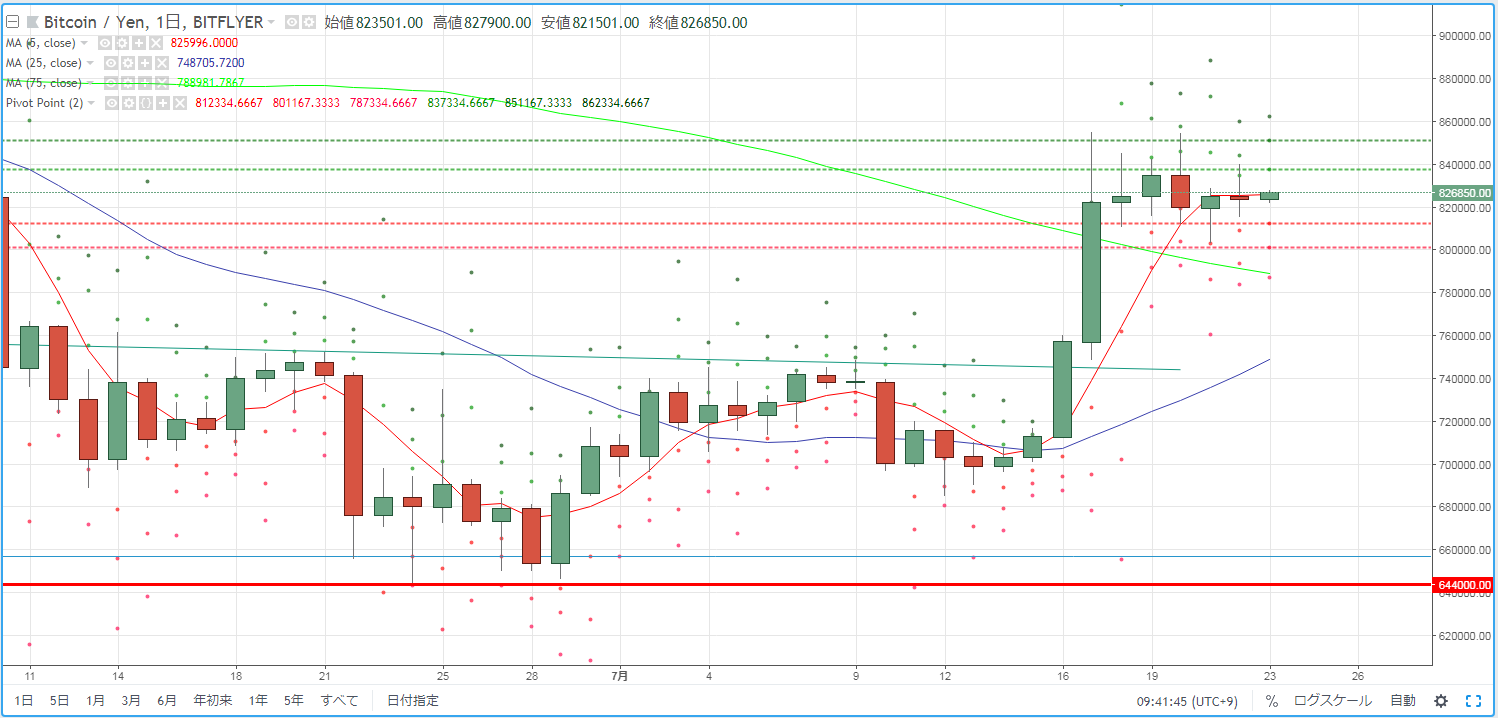
As a guideline for day trading BTCJPY, we check the pivot. Yesterday (July 22) the market showed a small-range movement at about the same level as the previous day.
The market environment was characterized by minor fluctuations throughout.
R2=851,167
R1=837,334
PP=826,167
S1=812,334
S2=801,167
※ Pivot points are a technical indicator used to forecast the range of price movement for the day based on the previous day's price action. Centered on the Pivot Point (PP), draw resistance lines (R1, R2) and support lines (S1, S2) above and below, and use them as trading guidelines.
【Calculation Formula】
Pivot Point (PP) = (Previous day's close + previous day's high + previous day's low) / 3
Resistance Line 1 (R1) = PP + (PP - previous day's low)
Support Line 1 (S1) = PP - (previous day's high - PP)
Resistance Line 2 (R2) = PP + (previous day's high - previous day's low)
Support Line 2 (S2) = PP - (previous day's high - previous day's low)


