

【BTCJPY】20180722 Daily Pivot
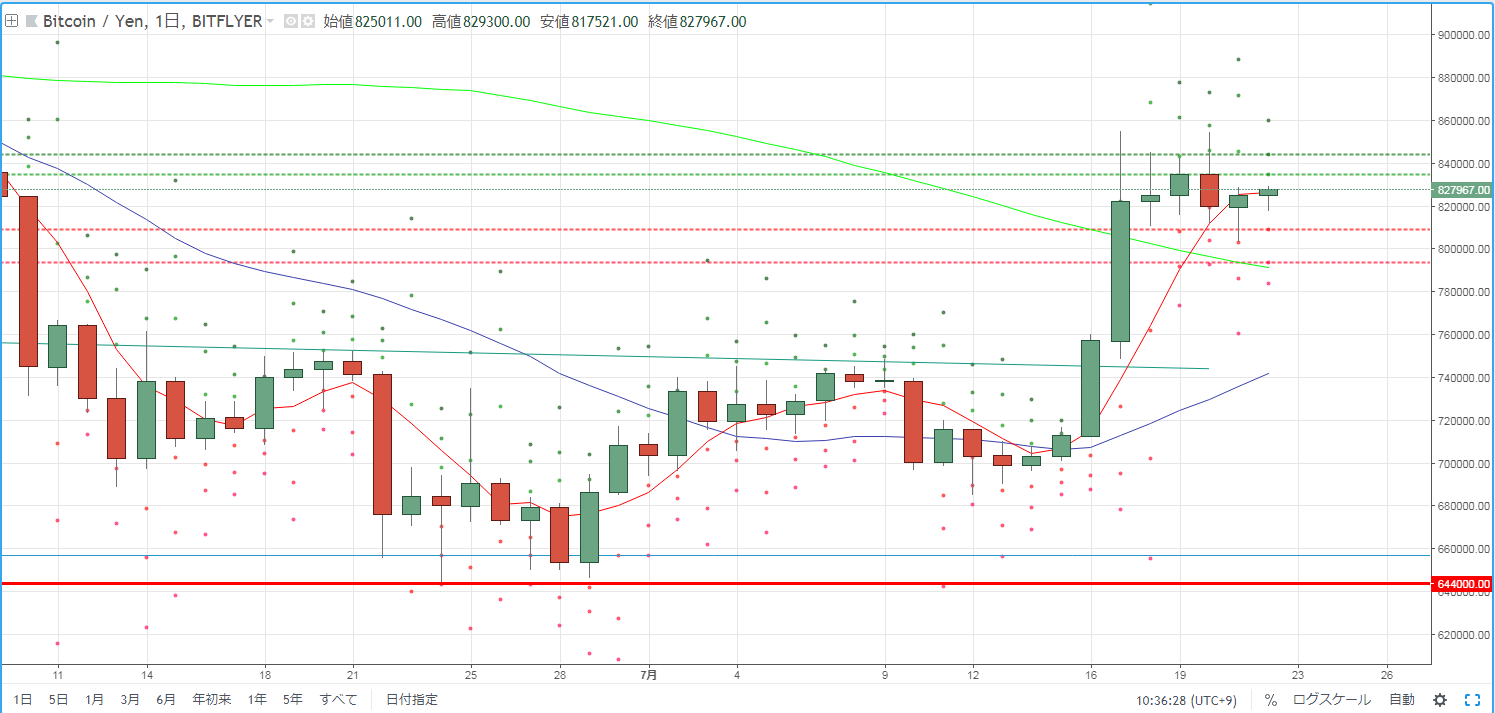
As a basis for day trading BTCJPY, we check pivot points. Yesterday (July 21) ended with a bullish candle, but the market environment was one where the previous day's high and low were being lowered.
R2=844,218
R1=834,614
PP=818,838
S1=809,234
S2=793,458
※ A pivot point is a technical indicator used to predict the range of price movement for the day based on the previous day's movements. Centered on the Pivot Point (PP), draw resistance lines (R1, R2) above and below, and support lines (S1, S2) below, and use them as trading references.
[Calculation Formulas]
Pivot Point (PP) = (Previous day's close + previous day's high + previous day's low) / 3
Resistance Line 1 (R1) = PP + (PP - previous day's low)
Support Line 1 (S1) = PP - (previous day's high - PP)
Resistance Line 2 (R2) = PP + (previous day's high - previous day's low)
Support Line 2 (S2) = PP - (previous day's high - previous day's low)


