

【BTCJPY】20180720 Daily Pivot
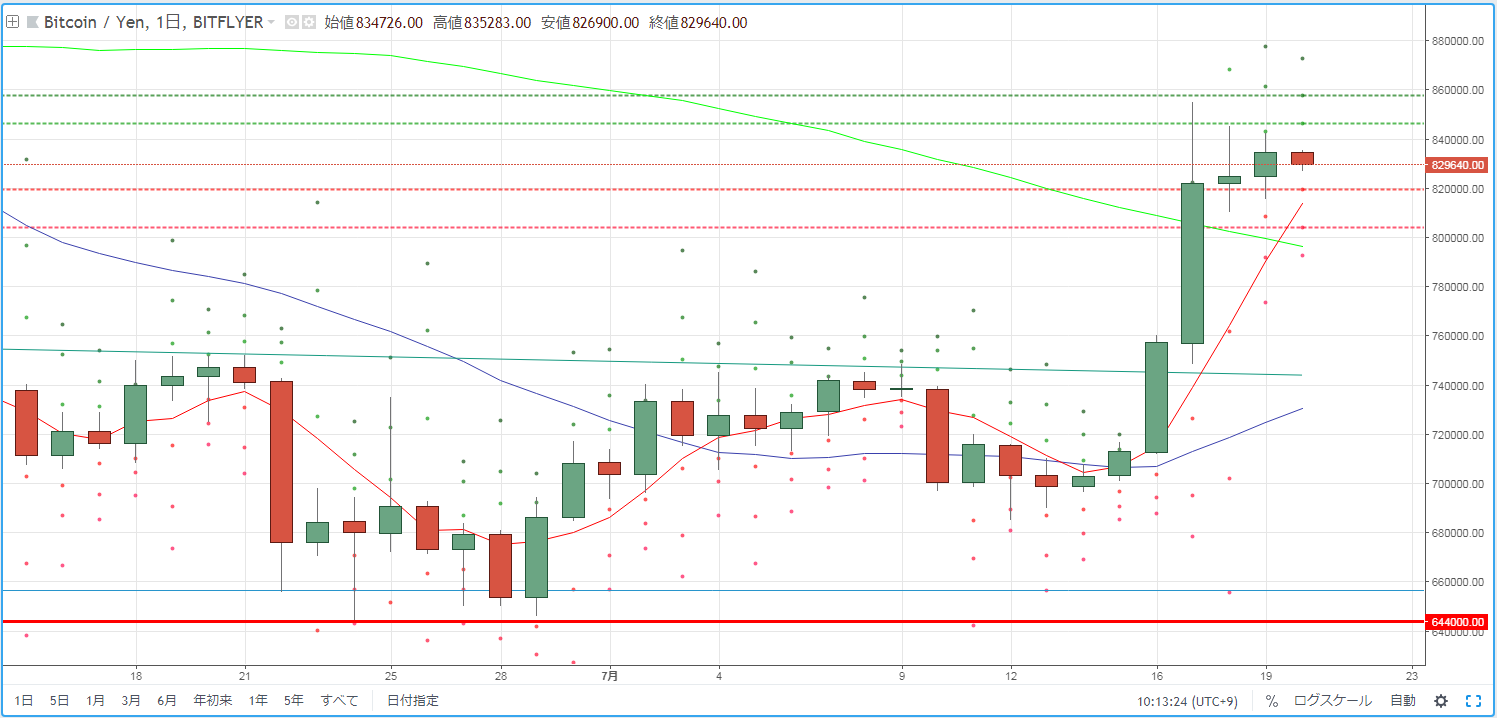
As a guideline for day trading BTCJPY, we check the pivot. Yesterday (July 19) the market drifted around the high near the neckline break of the inverted head and shoulders, just like the day before.
R2=857,535
R1=846,130
PP=830,795
S1=819,390
S2=804,055
※ A pivot is a technical indicator that estimates the day's price movement based on the previous day's price action. Centered on the Pivot Point (PP), draw resistance lines (R1, R2) above and below, and support lines (S1, S2) below, and use them as trading benchmarks.
【Calculation Formula】
Pivot Point (PP) = (Previous day's close + Previous day's high + Previous day's low) / 3
Resistance Line 1 (R1) = PP + (PP - Previous day's low)
Support Line 1 (S1) = PP - (Previous day's high - PP)
Resistance Line 2 (R2) = PP + (Previous day's high - Previous day's low)
Support Line 2 (S2) = PP - (Previous day's high - Previous day's low)


