

【BTCJPY】20180719 Daily Pivot
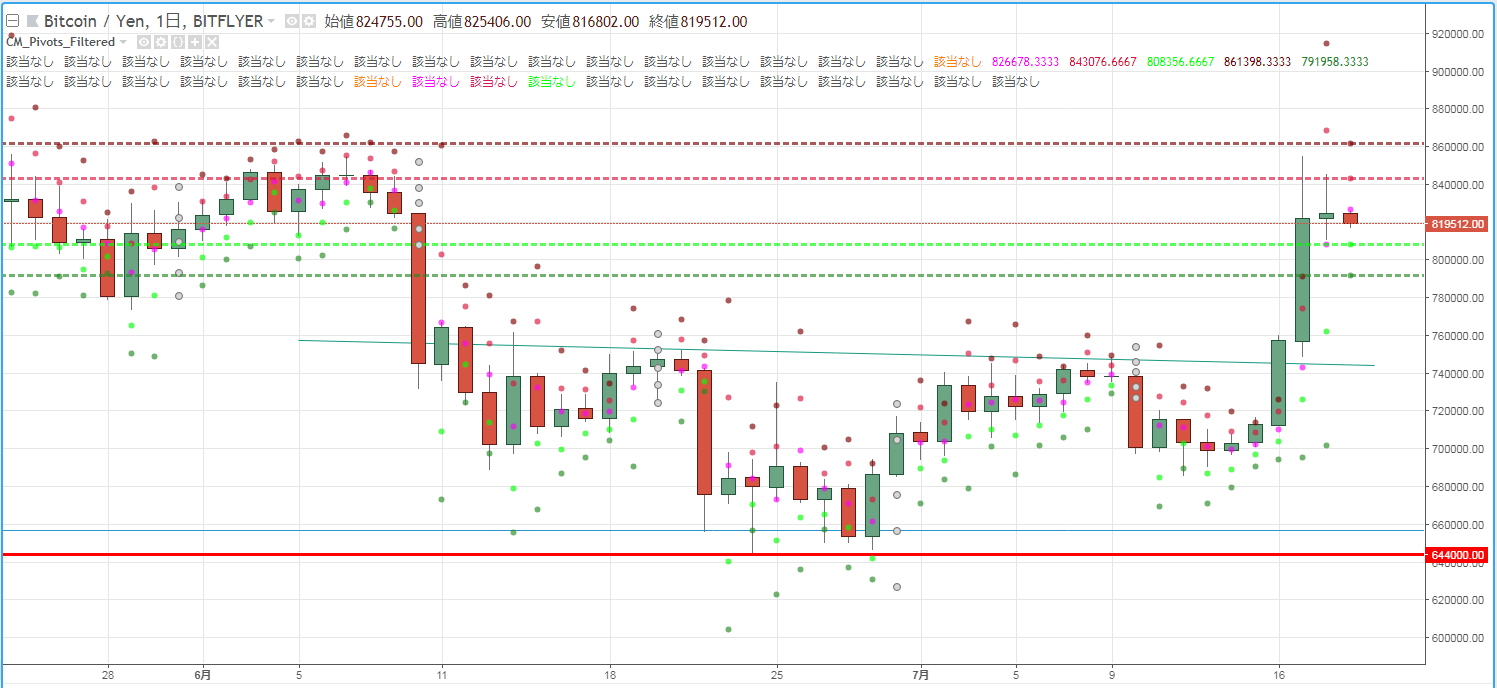
As a guideline for day trading BTCJPY, we check the pivot. Yesterday (July 18) the market was choppy around the high near the neckline break of the inverse head and shoulders pattern.
R2=861,398
R1=843,076
PP=826,678
S1=808,356
S2=791,958
※ A pivot is a technical indicator that predicts the price movement for the day based on the previous day's price movement. Using PP (Pivot Point) as the center, draw resistance lines (R1, R2) above and below and support lines (S1, S2) below, and use them as trading benchmarks.
【Calculation Formula】
Pivot Point (PP) = (Previous Day's Close + Previous Day's High + Previous Day's Low) / 3
Resistance Line 1 (R1) = PP + (PP - Previous Day's Low)
Support Line 1 (S1) = PP - (Previous Day's High - PP)
Resistance Line 2 (R2) = PP + (Previous Day's High - Previous Day's Low)
Support Line 2 (S2) = PP - (Previous Day's High - Previous Day's Low) (Please replace this part when publishing to the public)


