

【ETHJPY】Will it break away from the triangle consolidation?
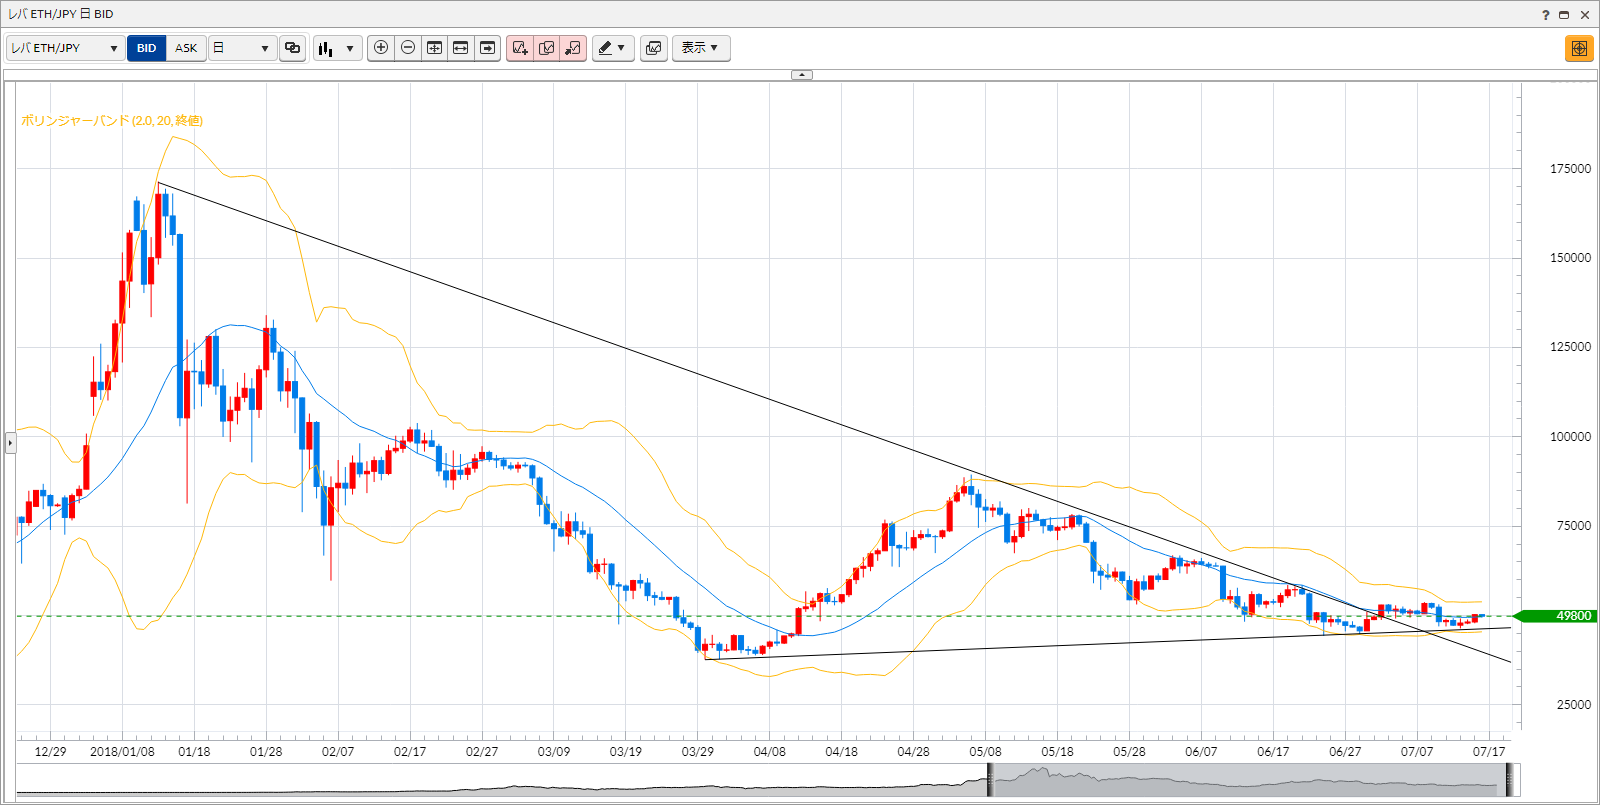
Using DMM Bitcoin charts, I will analyze the ETHJPY chart. Technically, Bollinger Bands (20 periods) are displayed, along with an upper resistance line drawn by connecting the high on January 13, 2018, on the daily chart, and a lower support line drawn by connecting the low on March 30, 2018. Currently, the price has broken out of that triangle pattern to the upside, but has not shown a clear rally, and Bollinger Bands are in a squeeze. From here, the first hurdle to clear on the way up is the recent high of 53,749 yen (July 8). This level also lies at +2σ of the Bollinger Bands, and whether we can surpass this level is the immediate concern.
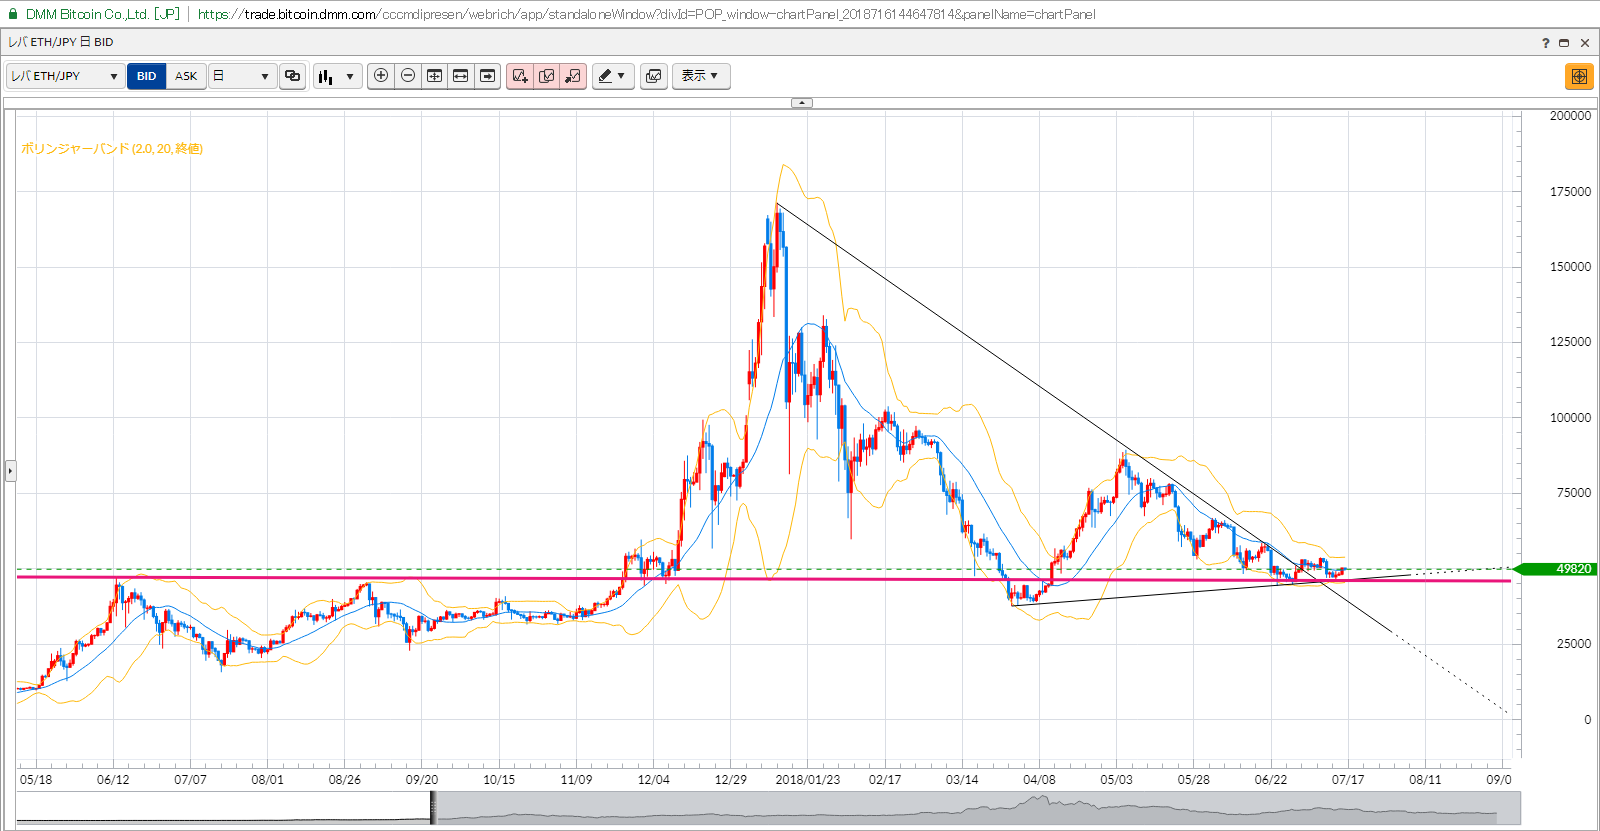
Additionally, the roughly 450,000 yen level where -2σ of the Bollinger Bands lies has historically acted as an important resistance/support line. For now, the scenario of breaking below this level will be kept in mind.


