【BCHJPY】Analyze Bitcoin Cash/JPY price movements using moving averages and Bollinger Bands
2017Year8Month Bitcoin Cash (BTC) was created by forking from BitcoinBCH).2018Year7Month11Date the market capitalization as of now is4ranked, and its market size is large; many people are probably trading it.
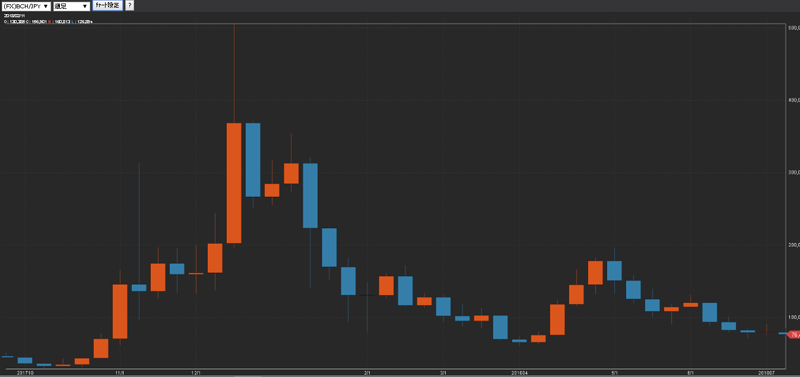
Looking back at past price movements briefly, last year12Month20Date saw a temporary peak above 50 million yen, but then reversed and started to decline. After that,4Month into early, until around early April, the price remained subdued, and the world's largest mining pool “Antpool” burned part of BCH fees, increasing rarity, andBCHhistory suggests a hard fork was planned inburn(burn/coin burning) and5Month, the hard fork was scheduled, which initially caused a rise, but it then turned down again and is currently7万円台 (in the seven-figure yen range) and at a low level. So far there is no sign of an increase.
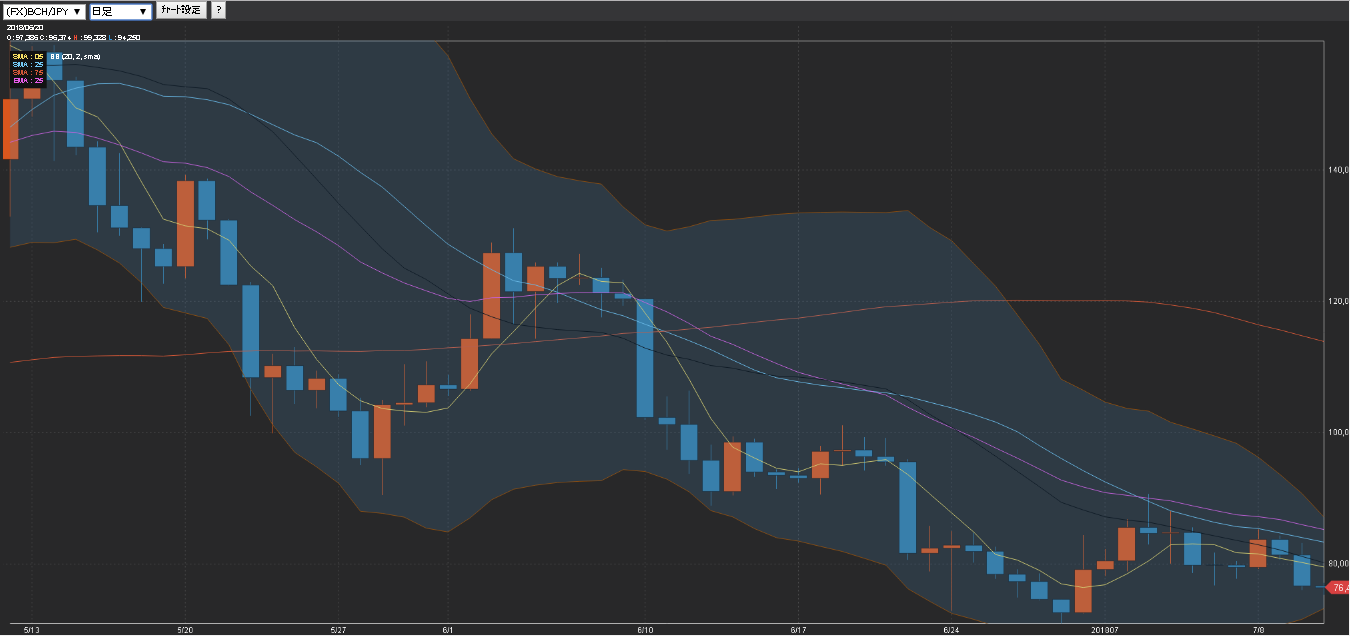
Now, from here we will analyze the chart on a daily basis. Here we useGMOCoin’s chart to display two technical indicators: moving averages and Bollinger Bands. As you can see in the lower image, since the June10th crash, the price has been moving below the right-leaningSMA25 (blue line) andEMA25 (pink line), clearly in a downtrend. Also, since entering July, the price movement has been held down bySMA25. In forecasting future movement, thisSMA25 may become a key point.
On the other hand, looking at Bollinger Bands, the band width has been contracting (squeezing), which could be a sign of an impending trend reversal. Going forward we should watch whether the price clearly breaks above theSMA25 or whether the Bollinger Bands continue to narrow and then expand (expansion). If you can identify these two movements, it might be a good moment to consider taking a long position.