
Calculate rebound targets for USD/JPY with the new feature 2 and current FX account balance (points & figures, Elliott wave theory)
The previous article is “Calculate USD/JPY rebound target with new features (Point & Figure, Elliott Wave Theory)”
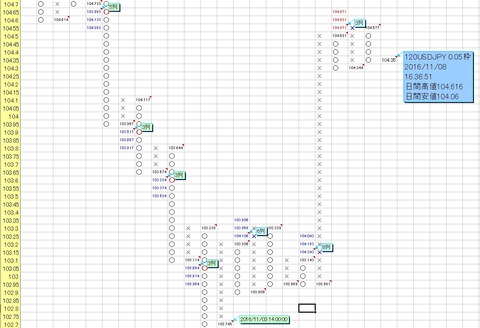
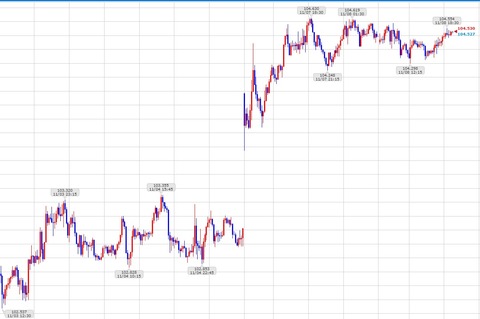
120-minute chart 0.05 yen P&F
120-minute chart 0.1 yen P&F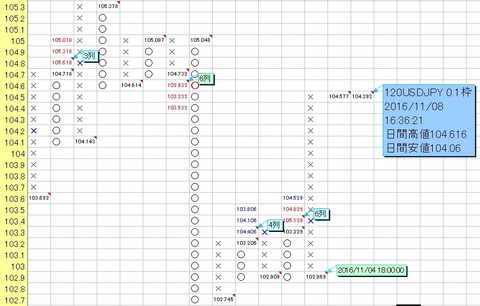
As shown above, a rising signal has appeared in the USDJPY 120-minute 0.05 yen & 0.1 yen P&F charts.
The maximum upside target is calculated to be 105.129 yen.
In the near term, it seems likely to fall, but according to the rules of Elliott Wave Theory, as long as it does not fall below 103.355 yen on 11/4 15:45 (the numbers reference the Platinum Chart on GMO Click Securities above), there is a possibility of rising up to around 105 yen.
On fx-on.com, the profile of kawasecfd states “Investment amount: 50 million to 100 million yen,”kawasecfdwhich may lead to doubts like “Do they really have that much money?”
Some of you may have such doubts.
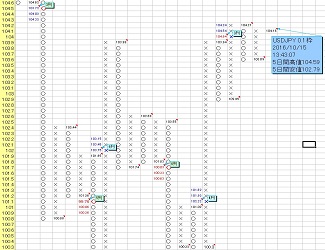
To prove the “Investment amount: 50 million to 100 million yen,” I will disclose the current SBI FX Trade account balance.
(※ Please note the date in the top-right is today’s date)
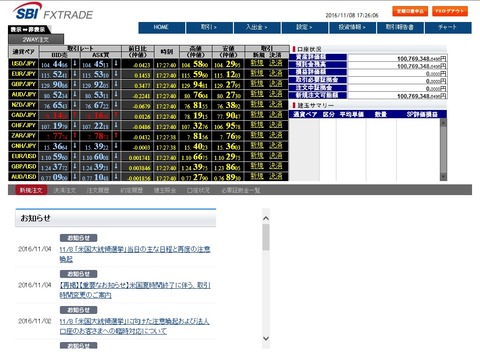
If you become proficient with the market forecasting tool, you will become a “100 million yen player” in a much shorter time than I did.
(※ Please note the date in the top-right is today’s date)
If you become proficient with the market forecasting tool, you will become a “100 million yen player” in a much shorter time than I did.
Until the market forecasting tool is completed, I recorded and calculated Point & Figure (secret chart) manually, and I did not use the “” or the “P&F on minute and hourly charts.”
Introduction to Point & Figure (Secret Chart)
For those who want to learn more about Point & Figure (Secret Chart)
× ![]()