

【BTCJPY】 Lowest price updated? Rebound? Focus on the chart
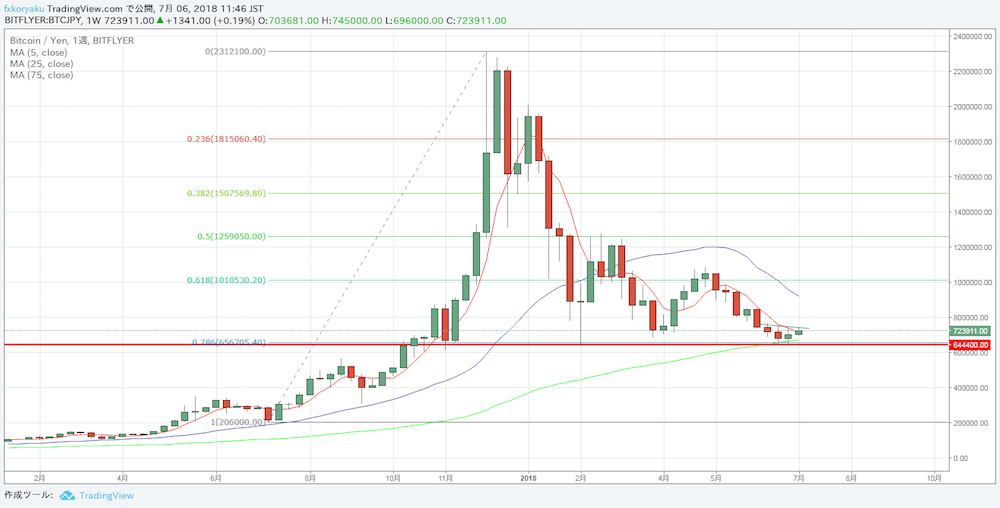
I will analyze the BTCJPY weekly chart. The moving averages shown are the basic combination of 5 (red), 20 (blue), and 75 (green). The horizontal line is drawn from the low of 644,400 yen in the week of June 18. This is the most critical line, having slightly dipped below the February 5 week low of 645,650 yen, i.e., it marks a new local low.
And at this level, two additional technical points coincide. One is the 75SMA. The other is the 78.6% Fibonacci retracement line drawn from the low in the week of July 10 last year to the high in the week of December 4. The convergence of these three at around 640,000 yen could become a watershed battlefield. It does not necessarily mean an immediate clash will occur, but it is important to note that in the weeks of June 18 and June 25, the price moved below the 75SMA's low.
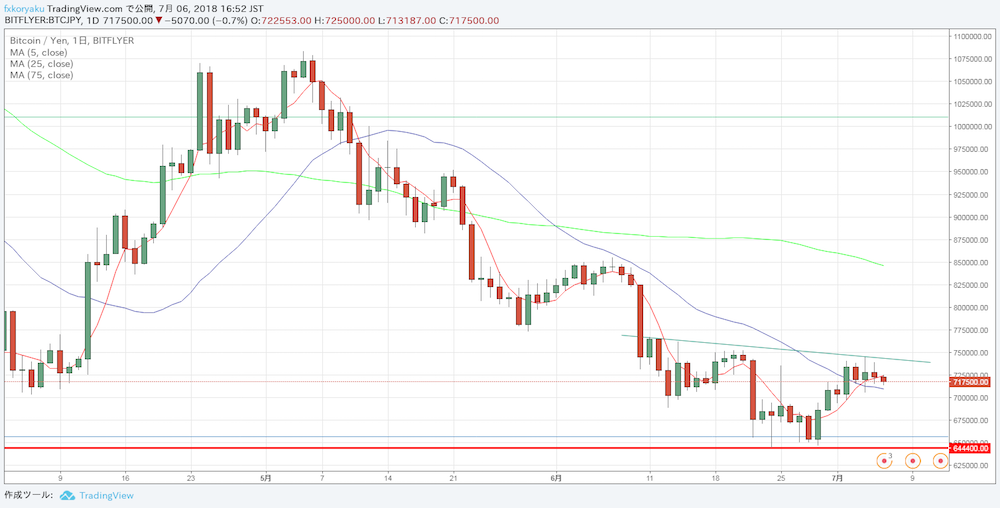
On the other hand, on the daily chart, the lows are gradually rising, and it appears to be forming an inverse head-and-shoulders pattern. However, this should be considered a range with about a 50,000 yen band around 700,000 yen. If the price breaks upward from this range, the distance from the neck line to the inverse head-and-shoulders low and neck line is about 100,000 yen, suggesting a target around 850,000 yen above the neck line. Then, centered around 750,000 yen, there would be a range with roughly ±100,000 yen, which would not negate a medium-term downtrend. The upper bound remains within the range, while the lower bound has no bottom. That is the kind of perspective I would like to adopt when positioning.


