Current status analysis of the USD/JPY: "Will the adjustment continue for the next three months as well?" July 1, 2018
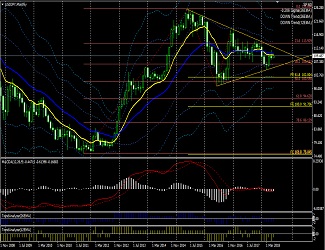
July 1, 2018 Dollar/Yen Monthly
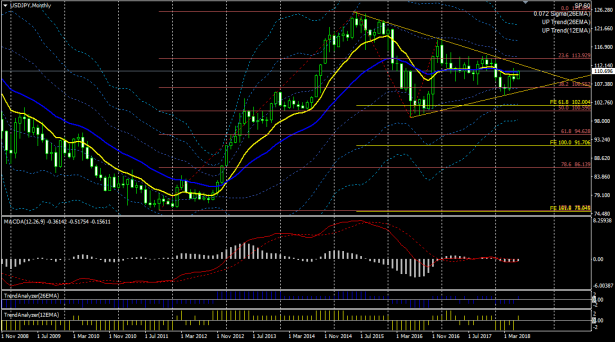
The current market conditions remain an adjustment phase from the upward trend of 2012 to 2015.
The upper and lower trendlines are in effect, and the chart pattern is forming a pennant. If we view it as a 5-wave pennant, it is currently considered to be Wave D. In the next three months or so, a Wave E will form within a narrow range, and if it moves into fall to winter, the pennant formation is expected to complete and a new movement will begin. If we assume the trend will continue, a resumed yen depreciation would occur, but reality may not be so simple.
Bolinger Bands and MACD show no clear trend.
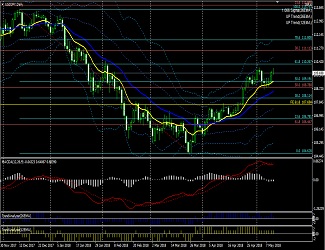
July 1, 2018 Dollar/Yen Weekly
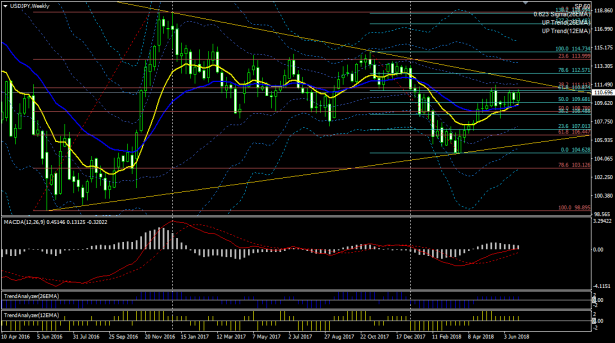
Currently, the upward swing (the D wave on a monthly chart) is still considered to be ongoing, but the pale blue Fibonacci retracement 61.8% from the 111 yen round number is acting as resistance, and even if aiming for 112 yen, it may be stopped just before the upper trendline. For the time being, the range in which the market can move is thought to be around 107 to mid-111 yen.
Looking at Bollinger Bands, it is evident that the range is compressing.
Also view another technical chart.
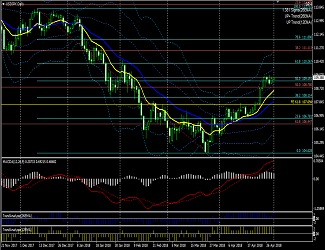
Also on the weekly chart.
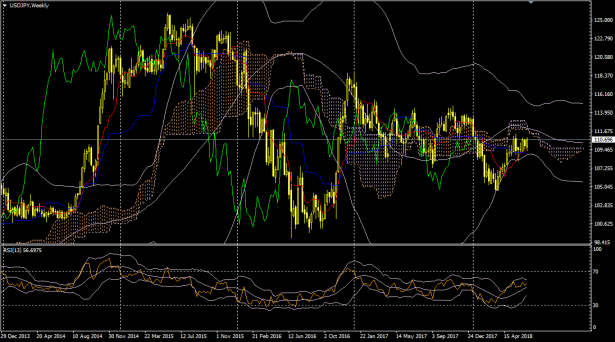
The main chart combines Ichimoku Kinko Hyo and Bollinger Bands. The Bollinger Band settings are as follows.
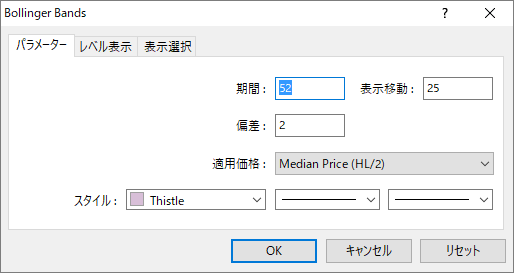
To overlay with Ichimoku, the 52-period band is advanced, and the applied price is set to half the high and low. The Leading Span 2 is changed to a simple moving average, and Bollinger Bands are added.
The sub-chart overlays RSI (13) with Bollinger Bands. The Bollinger Band settings are as follows.
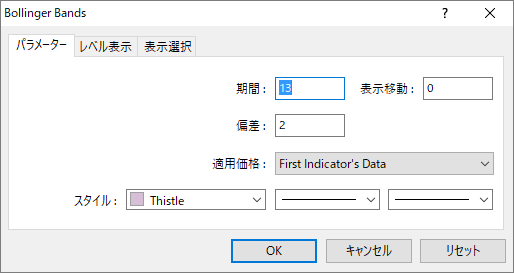
Short-term (13 weeks) market analysis is possible. A positive skew for bands is considered bullish, and a negative skew is considered bearish.
To start with, looking at the chart, after the candles turned downward earlier this year, the price reversed at the −2σ band, and since then has been moving between the −2σ line and the cloud. This tendency seems natural to continue for a while. If the market moves out of this region, a new move can be considered to have begun.
From the RSI, the current position is on the positive side of the bands, suggesting buying pressure, but the bands are narrowing and lack momentum.
Typically, RSI uses 50 as a boundary to judge buy/sell, but layering this over the bands allows for a faster determination of turning points. Furthermore, the shape of the bands helps read the market momentum.
↓ MACD used in the charts above.
Display MACD, Signal, and OsMA and set four alerts.
MACD (four alert types and email capable)
↓ The template and indicators for the chart above. Indicators can also be purchased individually.
MACD (four alert types and email capable) Trading System

Stochastic (alert and email capable) | MT4 indicator that can alert and email on cloud turn, etc. |
EA that earns profits by simultaneously placing buy and sell orders (trend-following and counter-trend) | EA that steadily builds profits with optimal trading |
This article is an excerpt from the blog “If you can see and freely place, the market becomes a lucky charm.”