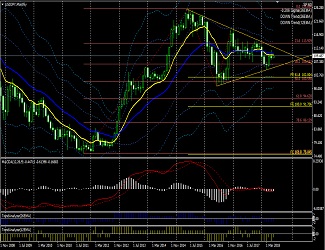
Current analysis of USD/JPY: "Weekly 12 EMA acts as resistance, daily chart is in a range." April 19, 2018 8:35
April 19, 2018 8:35 AM Dollar/Yen Weekly
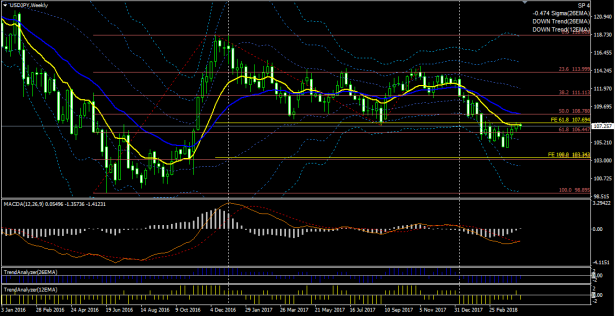
In the weekly chart, the downtrend is still continuing. The 12 EMA acts as a resistance to the upside, and it can be said that it is near a return high.
MACD has made a golden cross (not yet confirmed).
In the Trend Analyzer 26-period, the momentum of the decline is decreasing.
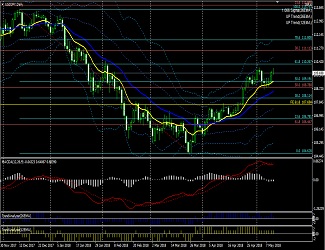
April 19, 2018 8:35 AM Dollar/Yen Daily
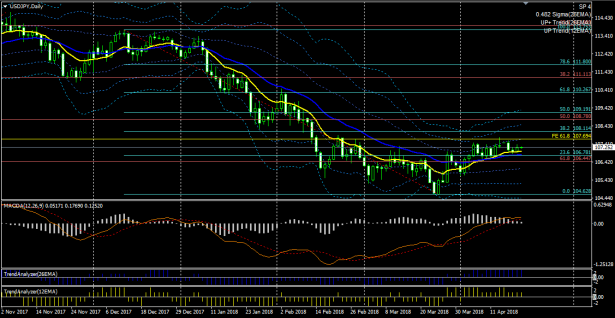
On the daily chart, there is an uptrend, but the Bollinger Bands are almost flat and the σ value is about 0.5, so there is almost no momentum.
After exceeding the light blue Fibonacci retracement 23.6%, it has been moving in a narrow range, entering a standoff state.
In the wave pattern, from the March 26 low, Wave 4 of the impulse sequence appears to be in progress, but the internal waves of Wave 4 are difficult to read. Wave a is still believed to be progressing.
MACD is positive and indicating an uptrend, but OsMA is declining, showing no momentum.
↓ MACD used in the chart above.
Display MACD, signal, and OsMA, and you can set four types of alerts.
MACD (four alert types, email possible)
↓ The above chart’s template and indicator set. Technical indicators can also be purchased separately.
MACD (four alert types, email possible) Trading System

Stochastic (alerts & email possible) | MT4 indicator that can send alerts by cloud/fog etc. (Ichimoku cloud turning etc.) |
↓ Now available at GoGoJumo. Both are showing steady profits.
EA that accumulates profit by trading both trend-following and counter-trend strategies | EA that steadily earns profits through optimal trades |
This article is an excerpt from the blog “When you observe and freely position, the market becomes a kakae no tsuchi (a magical tool for prosperity)”.