

July 14 (Fri): 【Harmonic】 Nikkei 225 (Lecture: Understanding the true meaning of MTF)
Good morning ⛅
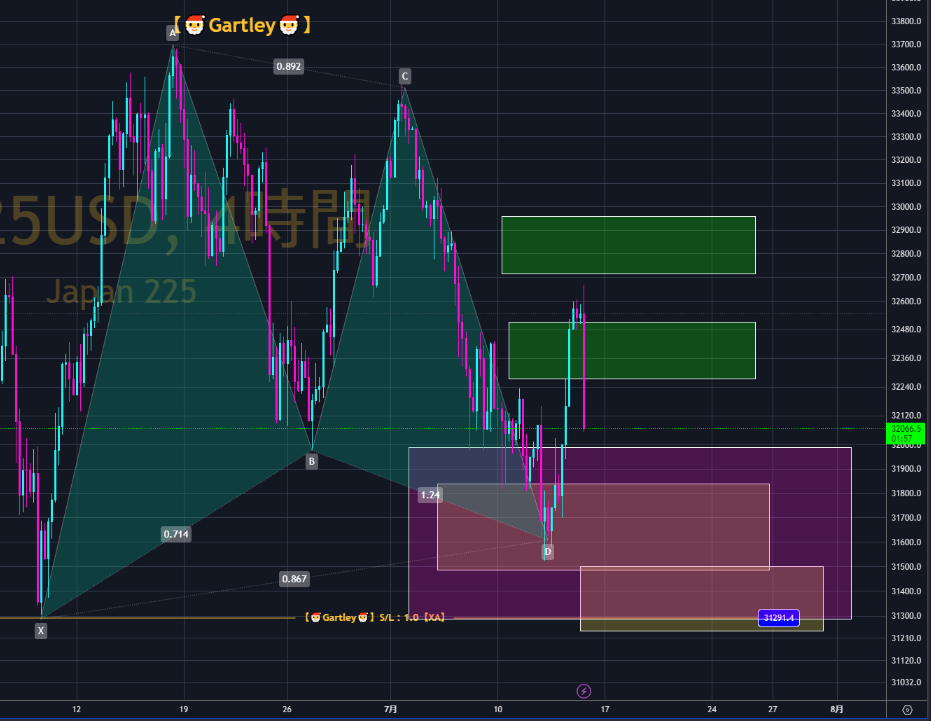
Gartley【4-hour chart】 appeared on the Nikkei 225.
Were you able to catch it?
For those who couldn't, how could you have caught it?
For those who did catch it, how could you have caught more?
Let's not settle for the current situation and aim for further growth!
It has reversed and started to descend after reaching the current First-Target-Zone.
This kind of price movement is common, so I mostly take profits at the First-Target-Zone.
Today I would like to write again about MTF (Multi-Time-Frame).
There are really many people who have a misunderstanding about MTF.
The way many people who can't keep earning view charts is:
Look at the weekly chart and think, “It seems it will go up.”
Look at the daily chart and think, “It seems it will go down.”
Look at the 4-hour chart and think, “It's sideways.”
Hmm, which is it after all?
There are many people who are very confused.
The reason is clear.
Because you view charts on all time frames as the same thing, it causes problems.
Seeing the time frames as separate layers is the true way to view MTF.
(Note: the following is for members only.)


