

June 9 (Fri): Nikkei 225 vs. Bitcoin (Course: Re-explanation of [Compared to the close 21 bars ago])
Good morning☔
【Comparison to the closing price 21 bars ago】
There are still some people who have not fully understood this, so here is another explanation.
I will explain again.
From the DMs I receive,
(1)It didn’t appear in “Exploding the Bollinger Bands” but is this a new indicator?
(2)Why compare whether MA will rise or fall with the 21 bars ago?
(3)If the current rate is above the closing price 21 bars ago, isn’t that a rising tendency, and if it is below, a falling tendency?
That is roughly the gist.
I will explain in order.
(1)It didn’t appear in “Exploding the Bollinger Bands” but is this a new indicator?
➥ This is basic content that does not need to be explicitly stated in “Exploding the Bollinger Bands,” so it was not included.
Sorry ????♂️
However, since many people did not understand how to view MA, I created the item “Comparison to the closing price 21 bars ago” in the newsletter and explained it in an easy-to-understand manner.
MA is the middle band of Bollinger Bands, so if you understand it properly, your overall understanding of Bollinger Bands will improve just by that.
(2)Why compare whether MA will rise or fall with the 21 bars ago?
Indicator misidentification — Calculation formula edition —
https://www.gogojungle.co.jp/finance/navi/articles/38557
Please also check this.
We are using a 21SMA, so we compare with 21 bars ago.
(3)If the current rate is above the closing price 21 bars ago, isn’t that a rising tendency?
Instead of comparing with the current rate, 21 bars ago will also progress one bar at a time in the future, so we compare the movement of the price 21 bars ago with possible future price movements.
By considering the movement of the price 21 bars ago, we also take time into account.
? Let’s actually look at the chart.
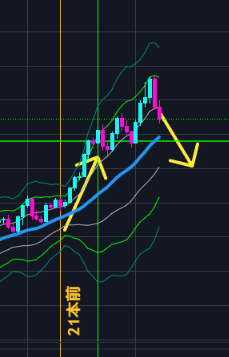
The current price 21 bars ago is the yellow vertical line.
The current price is now much higher.
What we consider here is not simply that it is higher than 21 bars ago, so MA is biased upward, but
① The price 21 bars ago will rise for eight days up to the green vertical line.
② If the rate drops in the future, it will likely be lower than 21 bars ago.
③ Thereforein about 6–8 daysif the price breaks below around the green horizontal line, MA is expected to turn downward.
(※In a sharp drop, it could turn downward sooner.)
Can you understand by following this sequence?
For example, if it breaks below the green horizontal line in two days, you are still comparing with the price two days ago, so the low to compare is still lower.
Therefore MA will continue to rise.
To consider the direction of MA going up or down,
“You need to understand the calculation formula.”
This is what it means.
To forecast in advance, the direction of MA must be considered in advance.
For that,“Understanding the calculation formula is essential.”That is what it is.
This way of thinking is basic introductory material.
It is the simplest way of thinking about SMA.
If you use EMA, it becomes more complex.
In “Exploding the Bollinger Bands,”
Shape of Bollinger Bands
Direction of SMA(=middle band of Bollinger Bands)
is considered to construct scenarios.
If you are using indicators,
be sure to understand from the calculation formula.
(Note: below this, it is limited to members.)


