
This week's USD/JPY trend
From the Double Trend Follow Signal

It's already mid-week, about USD/JPY movement...
Firston the 4-hour chartwe'll look at the Taiji (Taijitu).
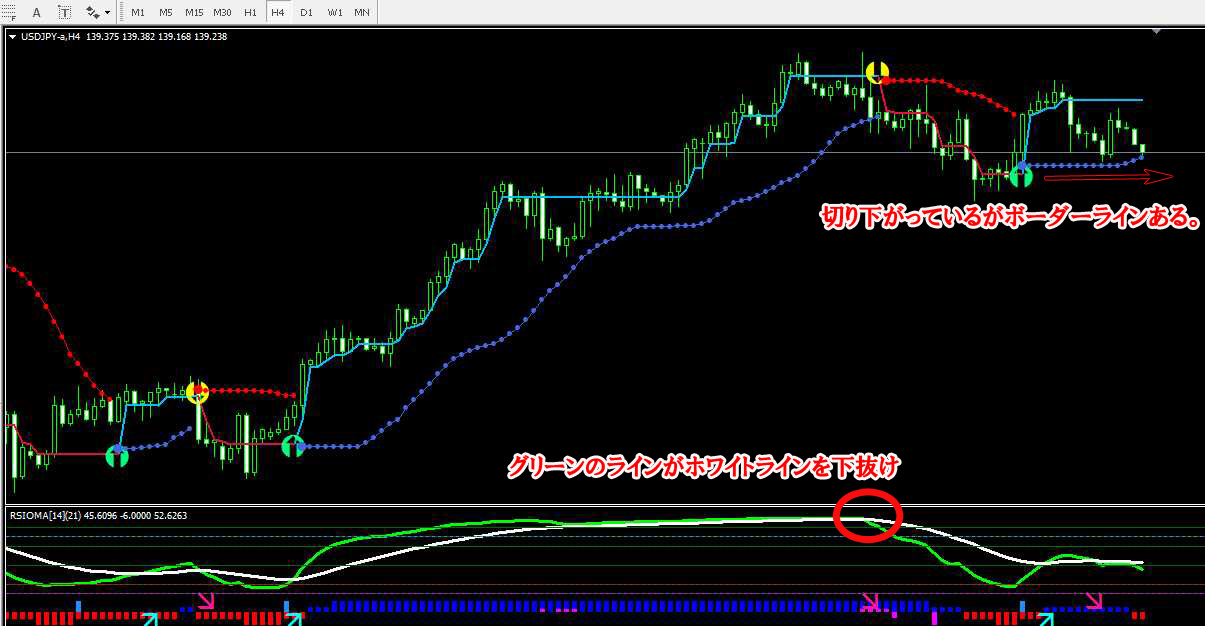
The sub-chart lines have crossed and fallen below.
However, it hasn’t dropped smoothly.
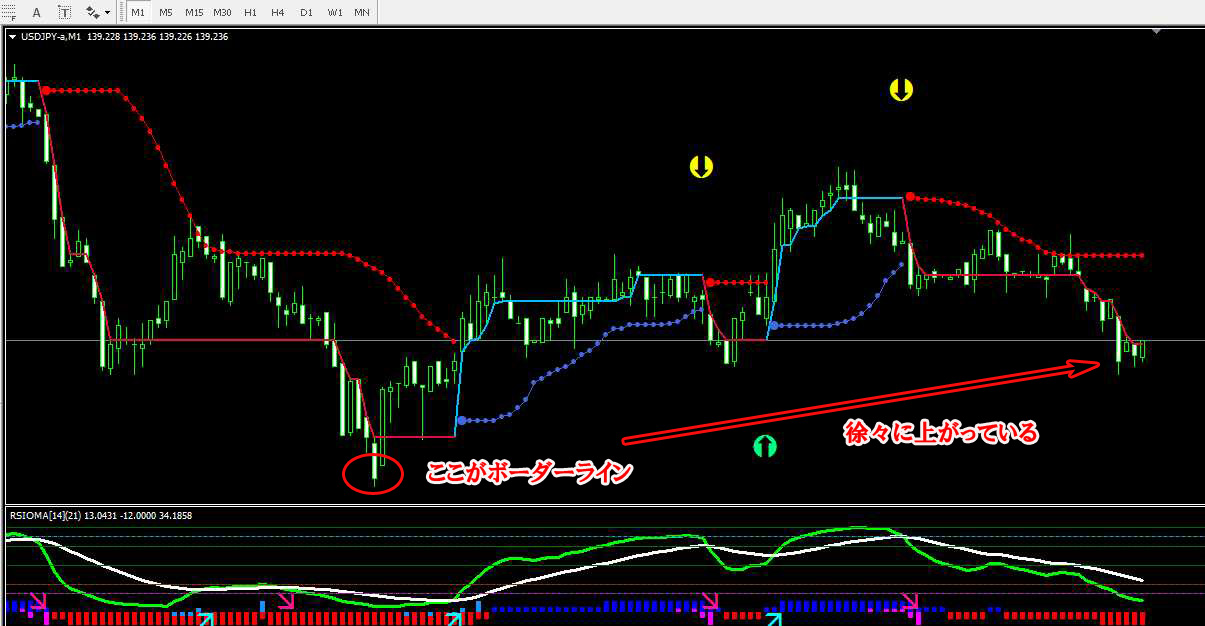
1-minute chart
As you can see on the 4-hour chart, there is resistance.
But breaking below it is only a matter of time...
〇 Trade while watching this area
The time zone seems to be around 1:00 PM as a border line, and from there it gradually rises, zigzagging.
Around 11:00 PM (likely because I wasn’t watching the whole time...)rises sharply!
Afterwards, it gradually declines across the following day.
Then around 1:00 PM it rebounds at the border line and gradually zigzags upward again.
Because this repeats, watch the flow well and take long and short positions accordingly.
Profit-taking (near the border line timing) is when the low prices gradually rise on the 1-minute and 5-minute charts.
Chasing too far is dangerous at this stage.
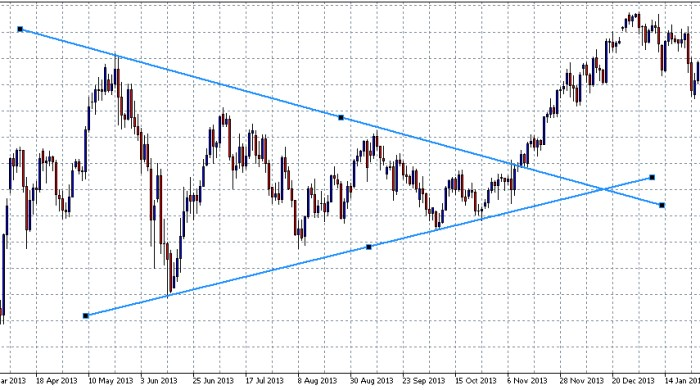
To gauge this, what’s called a triangle consolidation is occurring frequently.
If you can recognize this triangle consolidation, the bottom is a critical caution point!
What is triangle consolidation?
A triangle in a trading range is where buyers and sellers are fighting, and the movement you can predict may vary depending on the shape.
Three patterns
1. Symmetrical type Upward trendline + downward trendline
Direction of the breakout is uncertain.
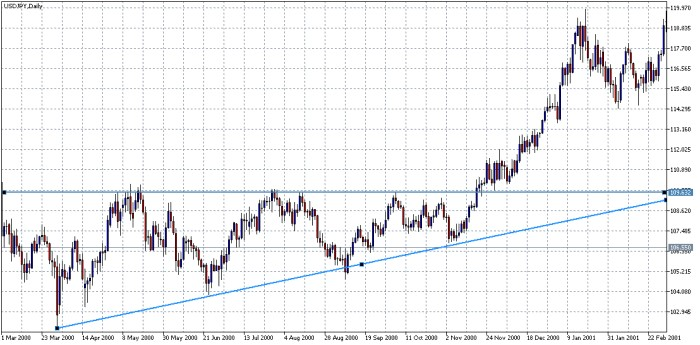
2. Ascending type Uptrend line + resistance line
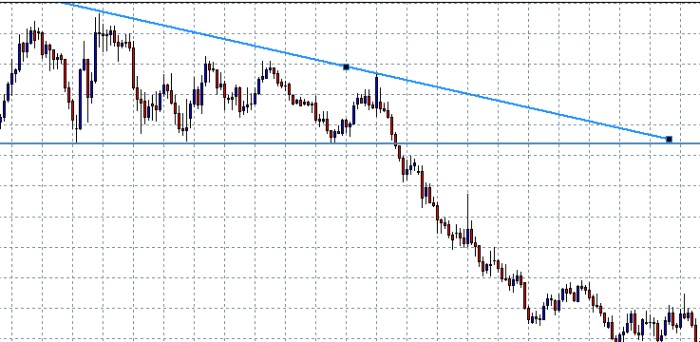
3. Descending type Downtrend line + support line
Illustrated explanations (images from OANDA)
1. Symmetrical type
2. Ascending type
3. Descending type
If you can recognize patterns like these, be cautious!
This week there are many symmetrical types, and it’s not clear which way it will turn...
If it goes against you, cut losses early!
Chasing greed will not yield good results.
This Double Trend Follow...can be judged by the sub-chart lines and the histogram.
Read the general picture on the 4-hour chart, and close positions on the 1-minute or 5-minute chart.
by Ichiyo