
USD/JPY (Dollar/Yen) Down Signal (Elliott Wave Theory · Points & Figures)
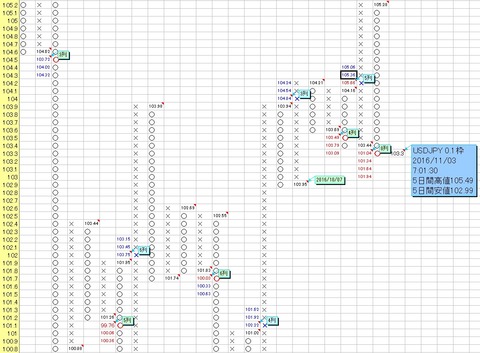
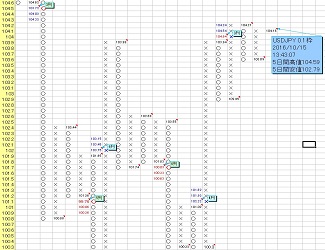
As stated above, a down signal has appeared on the USDJPY 0.1 yen frame Point & Figure.
The maximum target is calculated to be 101.04 yen.
In the previous article [Upside target and forecast for USD/JPY] I wrote that “if it falls below 102.811 yen on 10/10, the upward wave starting from 100.075 yen on 9/27 has ended.”
Currently it has not fallen below it yet, but there is a high possibility of a decline, and the upward wave starting from 100.075 yen on 9/27 may have ended.
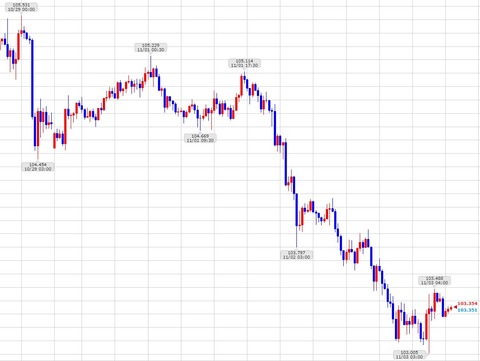
Here, I will calculate the target value of the downward wave starting from 105.531 yen at 00:00 on 10/29and calculate it.
If 105.531 yen at 00:00 on 10/29 is the 1st wave starting price, 104.454 yen at 03:00 is the 1st wave bottom, and 105.229 yen at 00:30 on 11/1 is the 2nd wave high, then (values refer to GMO Click Securities Platinum Chart above)
The 5th wave target value is calculated as 102.0458 yen ~ 100.9688 yen.
Since we are currently within the 3rd wave target zone, the 4th wave rebound is expected to begin soon.
After the rebound of the 4th wave ends, the 5th wave decline will begin, and if it approaches around 102 yen or the decline accelerates, a drop to around 101 yen is anticipated.
For those who want to know more about Elliott Wave Theory
Introduction to Point & Figure (Secret Chart)
For those who want to know more about Point & Figure (Secret Chart)
Introduction to Point & Figure (Secret Chart)
For those who want to know more about Point & Figure (Secret Chart)
× ![]()