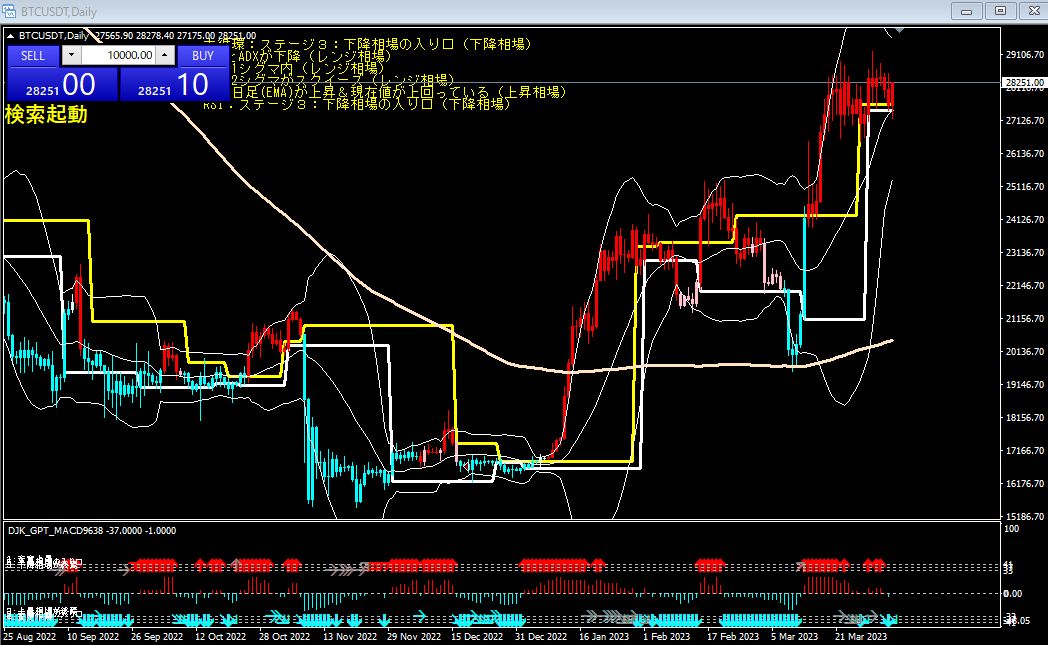
BTCUSDT Daily Chart April 4th 19:03
BTCUSDT Daily chart, 7:19 PM on April 4, current conditions are being met.
- Standard deviation range and ADX are declining (range-bound market)
- Within 1 sigma of the BB
- 2 sigma of the BB is in a squeeze
- 200-day chart (EMA) is rising and price is currently above it
- RSI: Stage 3: entering a downtrending market
- Large cycle: Stage 3: entering a downtrending market
From these conditions, BTCUSDT is currently judged to be in a range-bound market. In a range-bound market, the direction is more likely to be determined by a break of the BB at 1 sigma in either direction. The fact that the BB is in a 2-sigma squeeze indicates low volatility and weak directional strength. However, squeezes often resolve, and a large move can occur when that happens.
The 200-day chart (EMA) is rising, and the current price is above it, which indicates a medium-to-long-term uptrend. However, RSI and the large cycle are in Stage 3, indicating that the market is in the early stage of a downtrend. This suggests potential short-term adjustments or a reversal signal.
For trading decisions, consider the following points.
- In a range-bound market, wait and watch until breaking the 1-sigma of BB, or trade around the range highs and lows
- While the BB is squeezed at 2 sigma, volatility is low, so take profits or stop losses more quickly
- Consider using the 200-day EMA as a support line, or treat a break as a signal of a trend reversal
- The RSI and large cycle being in Stage 3 indicate increasing downside pressure, so approach long positions with caution
That is the analysis for BTCUSDT Daily chart at 7:19 PM on April 4.