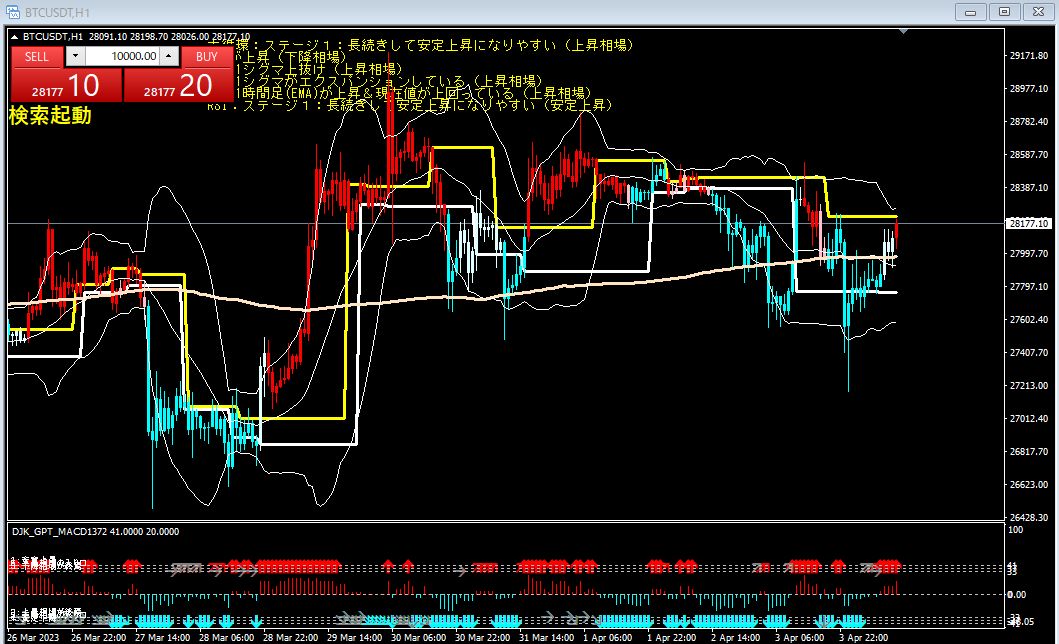
BTCUSDT 1-hour chart analysis at 18:58 on April 4.
BTCUSDT 1-hour chart April 4 at 18:58 analysis.
Currently, the following conditions are met.
- ADX rising (bear market)
- Price crossing 1 standard deviation above BB
- BB 1 standard deviation is expanding
- 200 on the 1-hour chart (EMA) rising and current price above it
- RSI: Stage 1: tends to stay persistent and rise steadily
- Major cycle: Stage 1: tends to stay persistent and rise steadily
From these conditions, it can be judged that the current market is bullish. For trading decisions, it is recommended to maintain the long position or add more buys. As a trading timing, since BB 1 standard deviation is expanding, volatility is high. Therefore, it is important to properly set stop-loss and take-profit levels. Also, since RSI and major cycle are in Stage 1, there is still room for upside. However, because ADX is rising, there is also a possibility of a downturn. In that case, it is recommended to take profits early or cut losses.