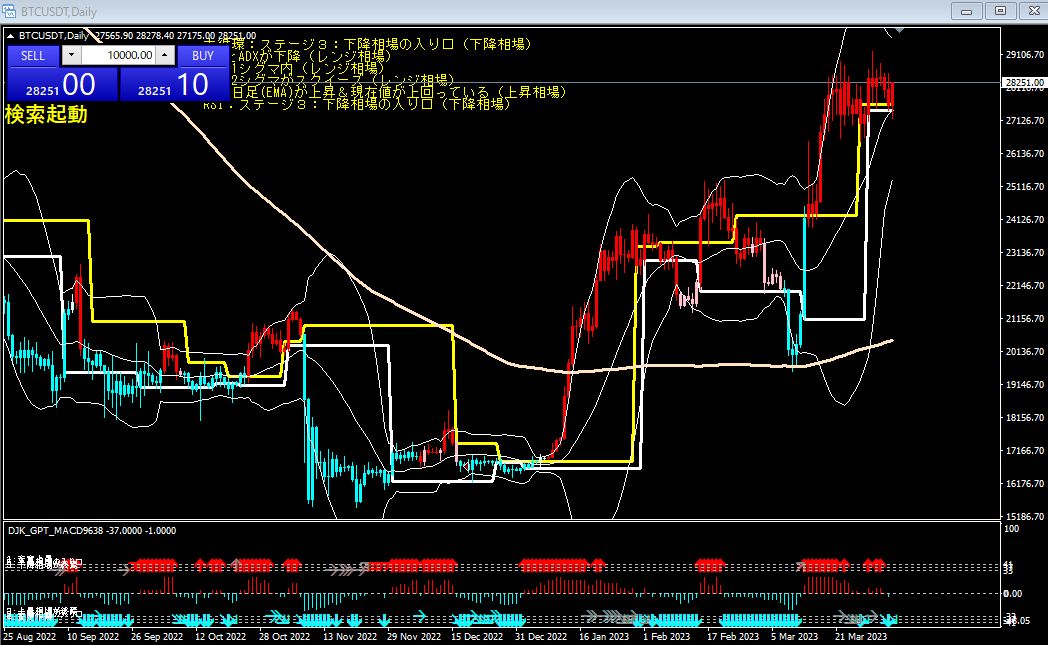
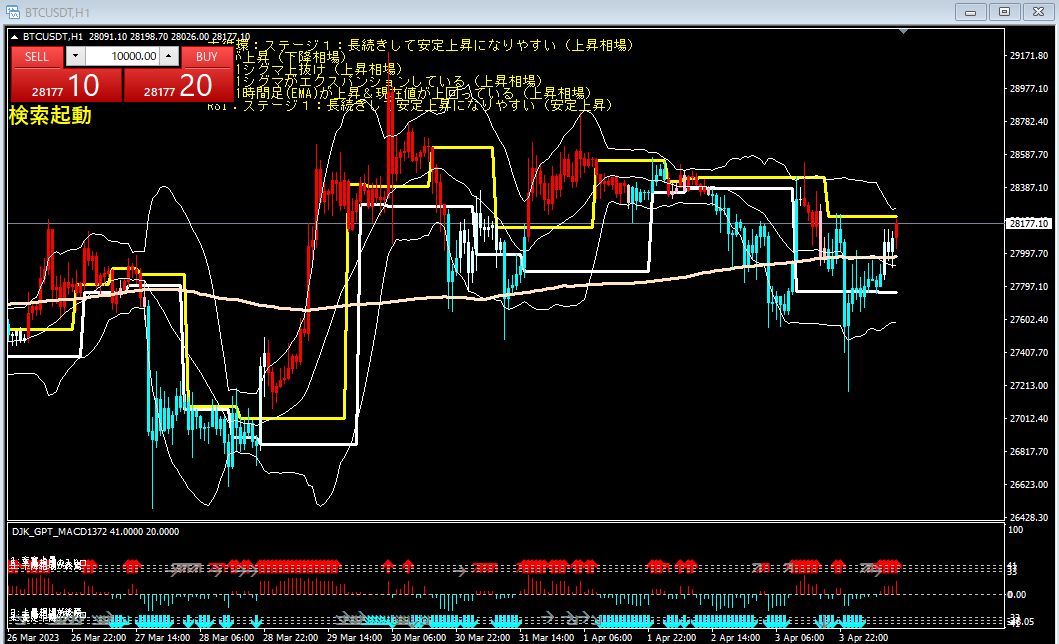
3/27 (Mon) 13:50 Bitcoin 1-hour chart range-bound market
Currently, we are in a ranging market. In the mid-term, there is an upward trend, but in the short term, a downward trend is highly likely.
Therefore, focusing on the selling side or trading at the upper or lower bounds of the range (counter-trend) would be an appropriate strategy.
A declining standard deviation range and decreasing ADX indicate low volatility with no clear direction, i.e., a ranging market.
Being within 1 sigma of the Bollinger Band implies that price movements are around average.
Bollinger Band 2-sigma squeezing indicates lower volatility.
200 on the 1-hour chart (EMA) rising and the current price above it suggest a mid-term uptrend.
RSI: Stage 3: entering a downtrend indicates increasing selling pressure.
Long-cycle: Stage 3: entering a downtrend indicates a long-term downtrend.
× ![]()