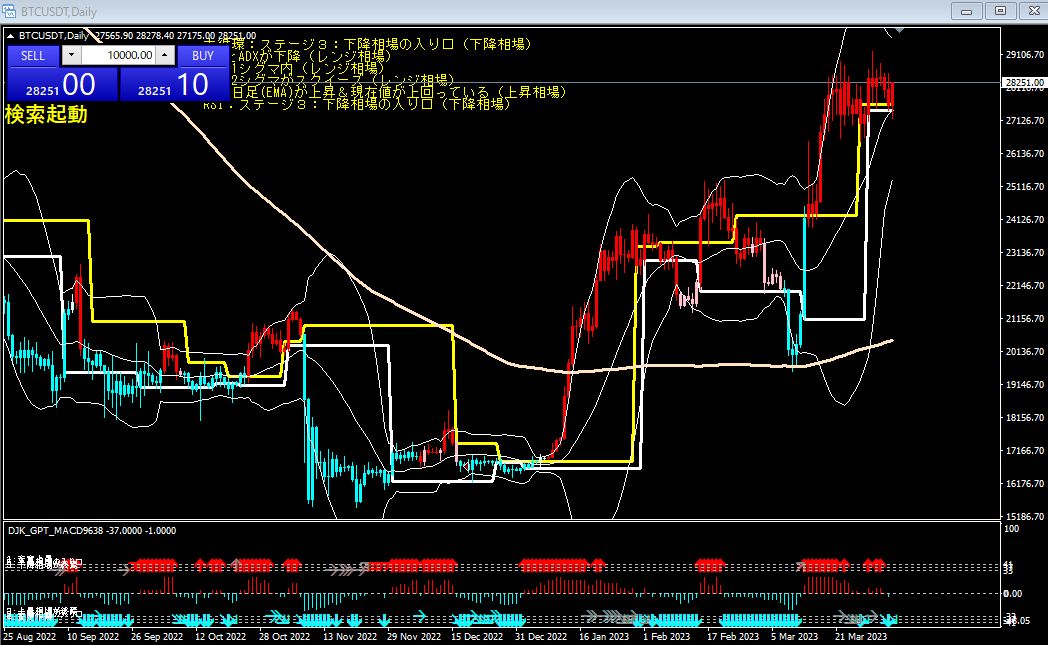
3/27 (Mon) Bitcoin daily chart analysis: range-bound market
Range trading range
The fact that the standard deviation range and the ADX are declining indicates a period of low price movement with no clear direction.
Also, being within 1 standard deviation of the BB and the 2 standard deviations of the BB squeezing indicates that
volatility is low and there are signs of a trend reversal.
The 200-day moving average (EMA) is rising and the current price is above it, which suggests a long-term upward trend, but
RSI and the broad cycle being in Stage 2 indicate that the uptrend may have ended.
Therefore, in short, the trading decision is:
Because we are in a range, caution is required.
Until the uptrend resumes, it is important to watch for selling pressure and to be mindful of support and resistance lines.
× ![]()