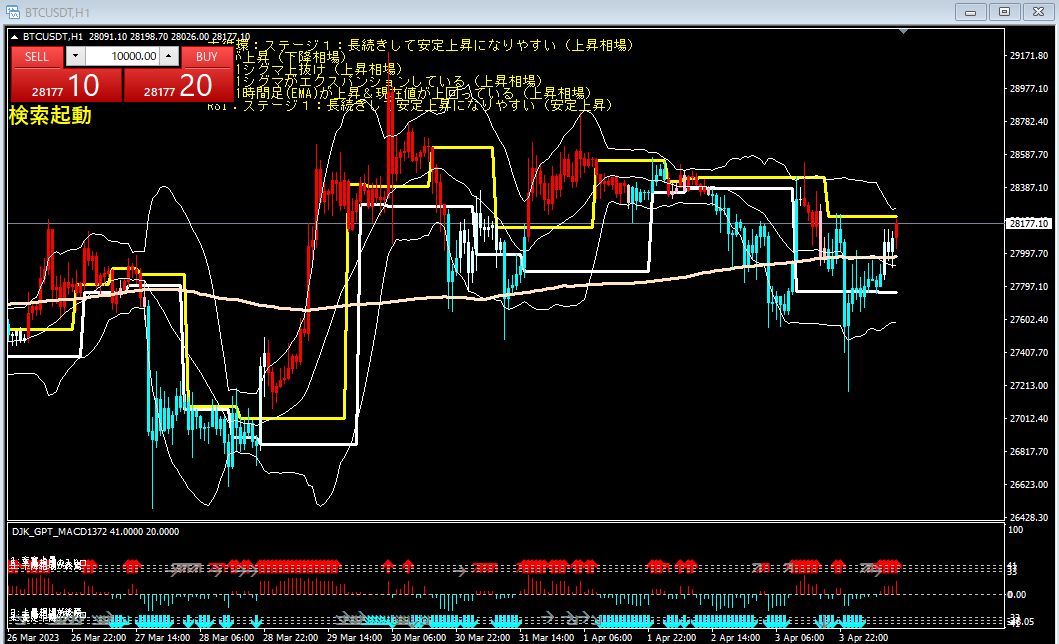
BTCUSDT 1-hour chart March 26 20:55 Buy
Buy
・ Both the Standard Deviation Range and ADX are rising (uptrend)
The Standard Deviation Range is an indicator that shows the width from high to low; when this width widens,
it means volatility is increasing.
ADX is an indicator that shows the strength of the trend; when this value is high, the trend
is continuing strongly.
On the chart, both the Standard Deviation Range and ADX are rising,
indicating that the uptrend is continuing.
・ Break above 1 sigma of the BB
BB (Bollinger Bands) is an indicator that shows the range of price fluctuations,
representing the central moving average plus and minus 1 sigma, 2 sigmas, and 3 sigmas.
On the chart, price has broken above 1 sigma of the BB,
indicating the uptrend is strengthening.
・ 200 1-hour EMA is rising and the current price is above it
EMA (Exponential Moving Average) is an indicator that shows the average price,
calculated with more weight on the recent prices.
200 1-hour EMA represents the average of prices over the past 200 hours.
On the chart, the 200 1-hour EMA is rising,
and the current price is also above it. This indicates a long-term uptrend.
・ RSI: Stage 1: tends to stay for a long time and rise steadily. Major cycle: Stage 1: tends to stay for a long time and rise steadily
RSI (Relative Strength Index) is an indicator of price strength;
it is expressed on a scale from 0 to 100.
Generally, RSI above 70 indicates overbought,
and RSI below 30 indicates oversold.
Stage 1 means RSI is in the 50 to 70 range,
indicating a stable uptrend.
A Major Cycle refers to the slope of the RSI moving average, also indicating a stable uptrend.
Based on the above conditions, the trading decision is Buy.