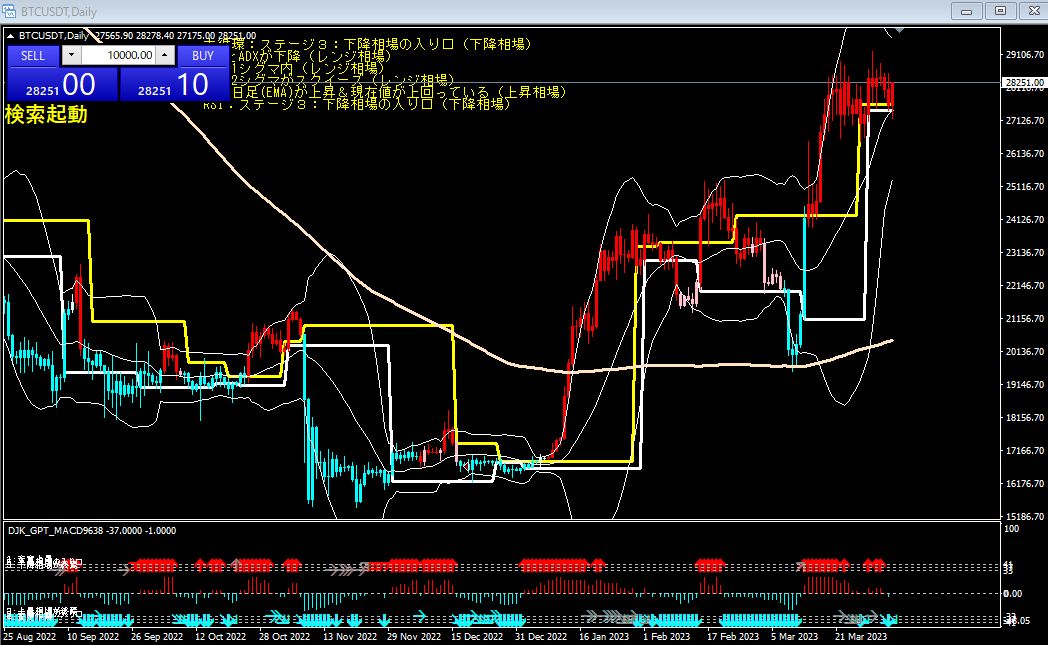
BTCUSDT Daily chart March 26 Sell
You can judge that the sell signal is strong. The reasons are as follows.
- The rising standard deviation range indicates a downtrend tendency.
- Being within 1 standard deviation of the BB indicates the price is close to the average, but the BB being squeezed at 2 standard deviations suggests low volatility and no clear direction.
- Even though the 200-day moving average (EMA) is rising, the current price being above it indicates a level higher than the past average, suggesting there is room for a decline.
- RSI and the Dow Theory cycle being in Stage 3 indicate we are at the entry of a downtrend, signaling increasing selling pressure.
For these reasons, under the current conditions it seems appropriate to either take a short position or wait and watch. Taking a long position would be too risky.
× ![]()