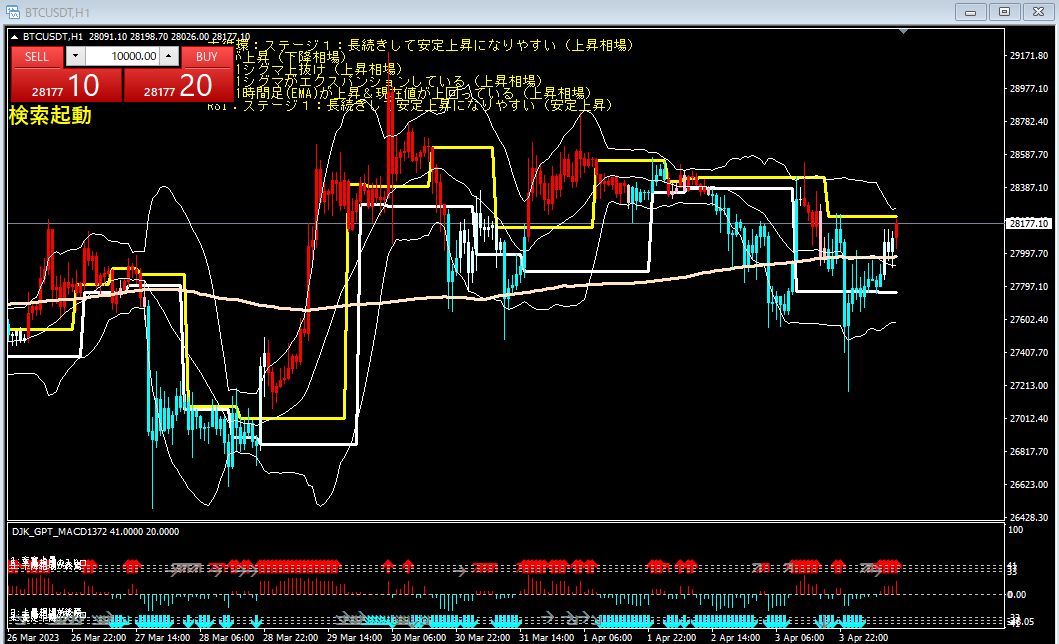
BTCUSDT 1-hour chart March 25 7:19 AM
Sell
A break below 1 standard deviation of BB, and the 2 standard deviations of BB are squeezing, indicating a sell signal.
A buy signal is also present because the 200 on the 1-hour chart (EMA) is rising and the current price is above it.
RSI is in Stage 4, and there is a tendency to stay low and decline steadily, which supports a sell signal.
The long-cycle is also in Stage 4, with a tendency to remain prolonged and decline steadily, which supports a sell signal.
From the above, since both the standard deviation range and the ADX are rising, the market may be in a downtrend.
× ![]()