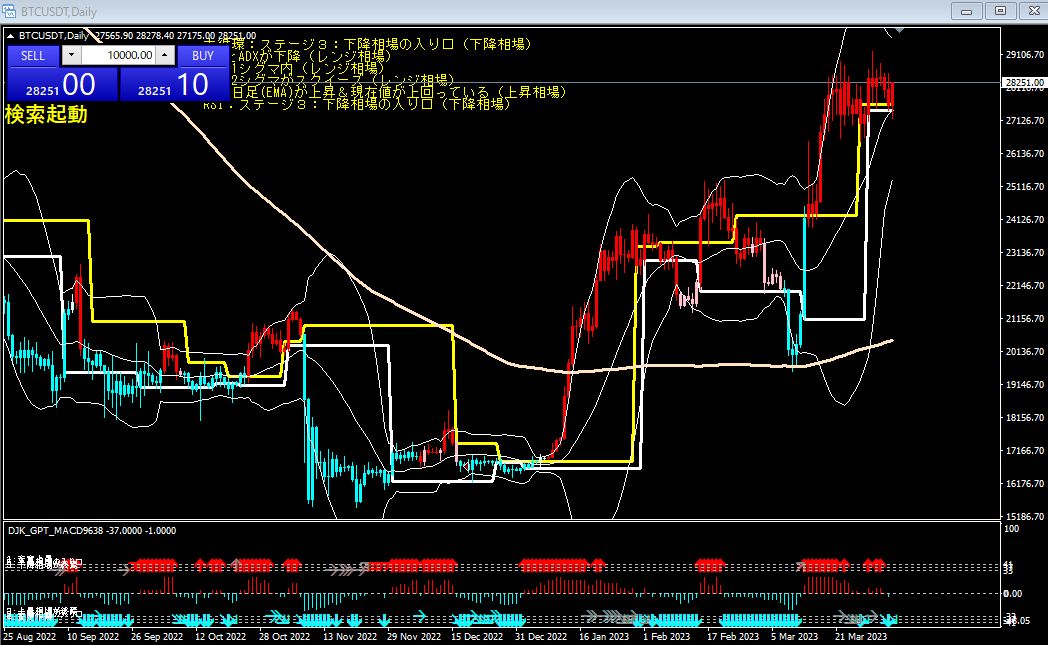
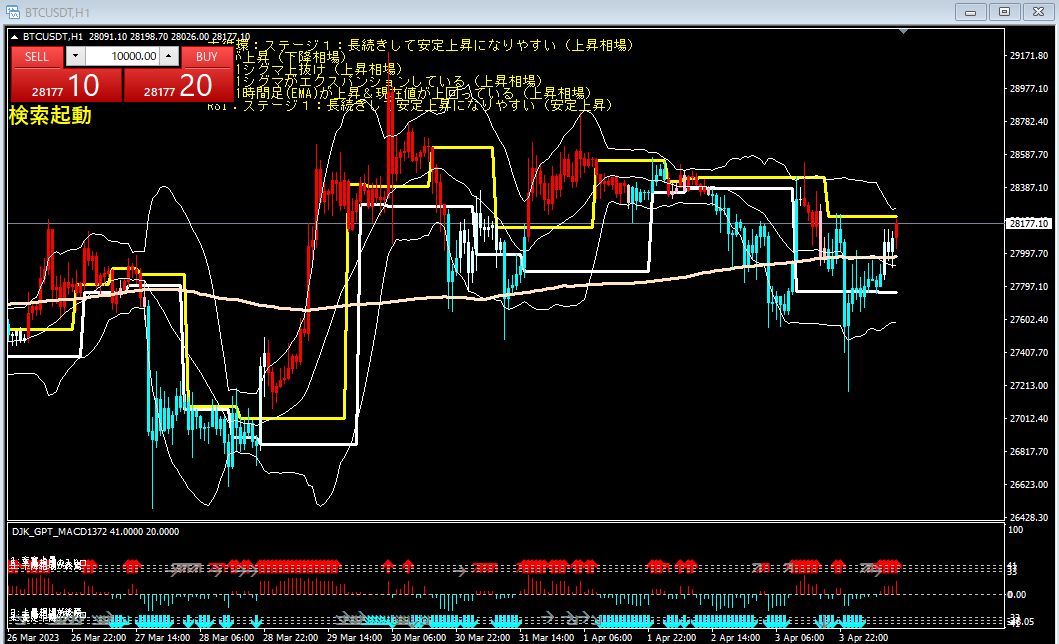
Bitcoin 1-hour chart analysis at 22:26 on 3/24 (Fri)
When both the standard deviation range and ADX are rising, it often indicates a downtrend.
If the BB drops below 1 sigma and 2 sigma bands are squeezing,
there is a potential for large movements, so caution is advised.
If a 1-hour EMA is rising and the current price is above it,
it may indicate an uptrend.
RSI tends to stay at Stage 4 for a long time and then gradually decline, which provides a selling edge.
The Major Cycle also tends to stay at Stage 4 for a long time and gradually decline in a stable manner.
Based on the above information, please make your investment decision.
× ![]()