Current status of USD/JPY analysis: "In a range just before 110 yen" May 10, 2018 19:00
May 10, 2018, after 19:00, USD/JPY daily chart
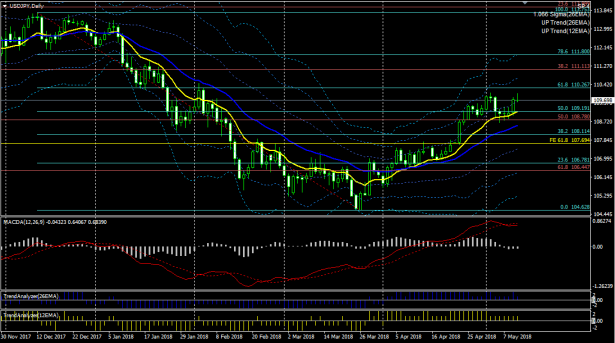
The pullback from the light blue Fibonacci retracement continues.
The 12 EMA is acting as support, but MACD has a death cross, and the upward momentum is fading.
Even when viewed with a trend analyzer, there is no momentum in both short-term and mid-term trends.
It seems to be forming a double top exactly at around 110 yen.
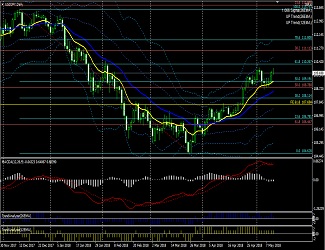
May 10, 2018, after 19:00, USD/JPY 4-hour chart
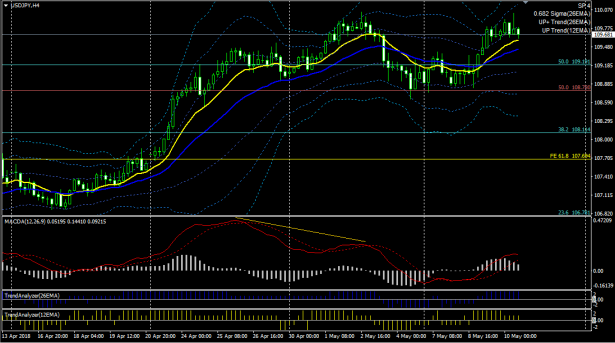
In the 4-hour chart, after a MACD divergence, the MACD line is oscillating around zero, indicating a range-bound market.
The Bollinger Bands are nearly flat as well, indicating a range market.
Even if a downward swing starts, it would be supported by the daily 12 EMA and 26 EMA, making a sharp decline unlikely.
↓ The MACD used in the above chart.
Show MACD, Signal, and OsMA; four types of alerts can be set.
MACD (four alert types, email capable)
↓ The template and indicator set for the above chart. Can also be purchased as standalone technical indicators.
MACD (four alert types, email capable) Trade System

Stochastic (alerts and email capable) | MT4 indicator that can send alerts and emails for cloud breakouts, etc. |
↓ Now on sale at GoGoXian (GoGoJian). Both are showing steady profits.
EA that profits by combining trend-following and counter-trend strategies | EA that steadily builds profits with optimal trades |
This article is an excerpt from the blog “If you can freely arrange your view, the market becomes a fountain of profit.”