

March 3 (Fri): Bitcoin (Free viewing item: parameters)
Good evening?
I was looking at the stars with my son today…
Dad: “Do you remember the three stars of the Winter Triangle?”
Son: “Pu… Pu… Prius!”
???
Close?
PuLoki on and Riusuriusthey stuck together, didn’t they lol
I wonder if Prius missiles are flying in the sky too? lol
That was a moment that made me chuckle a bit lol
Now today, I’ll answer the question I received.
“The parameter can be anything, but when it differs by 1, the band may either be closed or open. How should one judge?”
What is called an “effective method”
The parameter must be ○○!
is not a matter ofmindsetbut rather
So, what you often see in products
・Please set the parameter to ○○!
・I found a miraculous parameter!
・Using this parameter yields amazing profits!
types like theseare all fake marketing lines.
This I can say with certainty.
Indeed, changing the parameter slightly changes the indicator’s reaction speed.
Therefore, if you lower the parameter, you might feel you can catch reversals and tend to keep making it smaller.
But a faster reaction also means it reacts quickly to movements that may reverse again, and it tends to be swayed by the so-called “false signals.”
※Personally, I dislike the word “false signal.”
Indicators are calculated from a base, so there cannot be a “false signal.” Indicators merely visualize past price action, so it’s not false signals; it’s just the future being predicted by the past and you getting misled, right? That’s the argument.
(Just my personal note…)
? Let’s actually see it
I drew Bollinger Bands with parameters from “20” to “30,” ten bands in total.
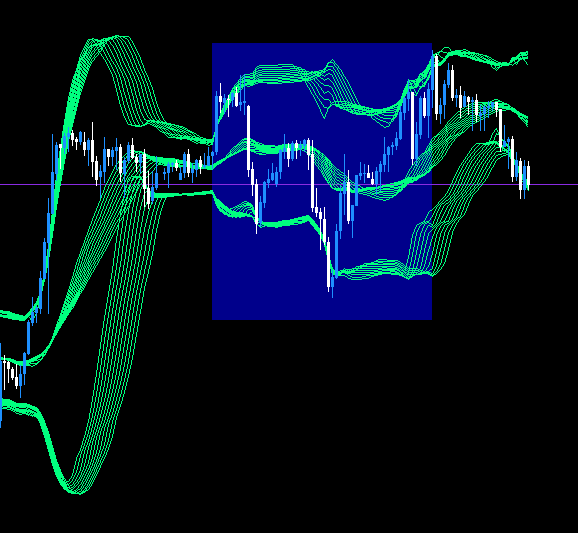
The left side under Expansion doesn’t change much, does it?
And the part enclosed in blue.
A chart that isn’t cleanly moving up or down, more like a horizontal channel state.
Around here it’s messy, so small parameters might be more easily fooled, right?
What I want to say“Mindsetis
Bollinger Bands are calculated from an MA, and then standard deviation is derived from that.
So think in terms of
Based on how the rate moves
① What kind of movement might the Bollinger Band’s MA indicate going forward?
② How is the shape of the Bollinger Band expected to change?
③ And then use the characteristics of the band shape to narrow down the possible price moves!
That is how I recognize the environment.
By making predictions, you can construct scenarios.
And among the multiple scenarios, which one has the edge?
That is what you think about.
Therefore, it isn’t about tiny things like how the parameter is set, but
if you view the market from a bigger perspective, your chart-reading will change.
If you’re unsure, it might be interesting to display multiple BBs like GMMA!
I’ve already experimented with GMMA-BB (a coined term for BB displayed like GMMA) and GMMACD (GMMA+MACD coined term) in charts, so I’ve gained experience?
(※ Below, environment recognition is limited to members.)


