
Dollar/Yen (USD/JPY) Upside Target and Forecast (Elliott Wave Theory, Point & Figure)
0.2 yen frame P&F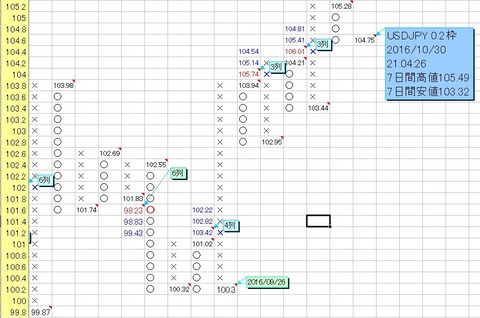
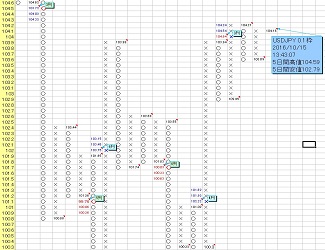
0.1 yen frame P&F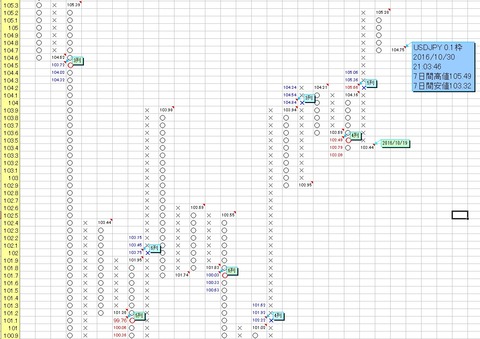
![]()
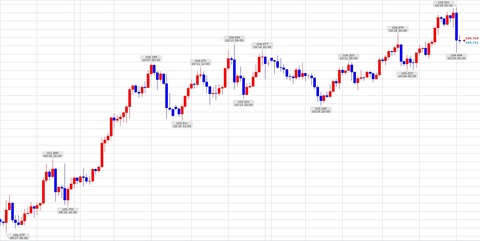
Starting from 100.075 yen on 9/27, the upper target for the USDJPY rising wave will be calculated from.
If we take 100.075 yen on 9/27 as the start of Wave 1, 101.84 yen on 9/29 as the high of Wave 1, and 100.732 yen on 9/30 as the low of Wave 2, the values above refer to GMO Click Securities platinum chart.
The fifth-wave target value is calculated to be 105.7865 yen ~ 107.5515 yen.
On 10/29, 105.531 yen comes quite close to the minimum target of Wave 5.
It seems to retreat for a moment, but next it is expected to start rising toward the 106 yen vicinity of the 0.2 yen frame target.
However, according to Elliott Wave Theory rules, if the price falls below the third-wave bottom at 102.811 yen on 10/10, the rising wave starting from 100.075 yen on 9/27 will be considered finished.
For those who want to know more about Elliott Wave Theory
Introduction to Points & Figures (Secret Chart)
What Points & Figures (Secret Chart) are
For those who want to know more about Points & Figures (Secret Chart)
I uploaded a creation video of USDJPY Points & Figures (Secret Chart) to YouTube
For those who want to know more about Elliott Wave Theory
Introduction to Points & Figures (Secret Chart)
What Points & Figures (Secret Chart) are
For those who want to know more about Points & Figures (Secret Chart)
I uploaded a creation video of USDJPY Points & Figures (Secret Chart) to YouTube
× ![]()