
Current Analysis of USD/JPY: The weekly 12 EMA acts as resistance, while the daily is in a range. April 10, 2018 14:00
April 10, 2018 14:00 around, USD/JPY weekly chart
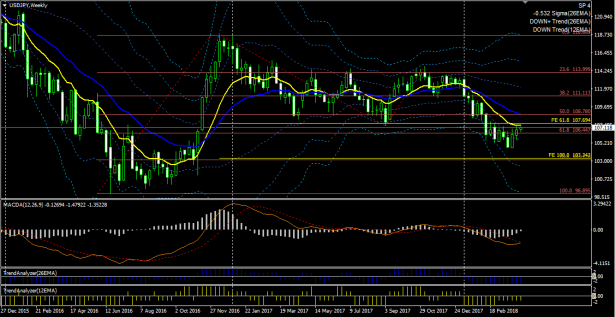
In the weekly chart, the downtrend continues, with the 12-period EMA acting as resistance, and price is currently around the pullback high.
On the 26-EMA Trend Analyzer, the decline is strong, but the σ value is around -0.5, indicating the momentum of the trend is weakening.
The 12-EMA Trend Analyzer shows a weak downtrend continuing.
MACD is on the verge of a Golden Cross.
April 10, 2018 14:00 around, USD/JPY daily chart
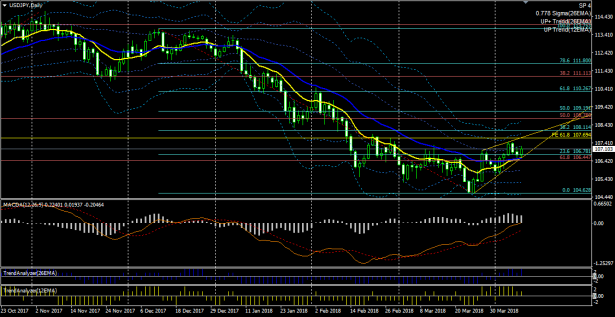
The 26-EMA Bollinger Band on the daily chart is nearly flat, indicating a range-bound market.
Currently, the candlesticks are above the EMA, with buys favored.
The MACD line is near zero (the EMAs are overlapping).
If you connect the highs with each other and the lows with each other via a trendline, it forms an ascending wedge.
When considering this together with the light blue Fibonacci retracement and Bollinger Bands, the upper target around the 38.2% Fibonacci retracement level would be near 108.11.
↓ This is the MACD used in the above charts.
Display MACD, Signal, and OsMA, and set four types of alerts.
MACD (four alert types, email capable)
↓ The template and indicators used in the above charts. You can also purchase technical indicators separately.
MACD (four alert types, email capable) Trading System

Stochastic (alerts and email capable) | MT4 indicator that can send alerts and emails on Cloud breakouts, etc. |
↓ Now available for sale on GoGoJiang (GoGoJangan).
EA that profitably pursues both trend-following and counter-trend trading simultaneously | EA that steadily builds profits with optimal trades |
This article is an excerpt from the blog “When you watch and adapt, the market becomes a magic wand you can wield.”