

December 29 (Thu): USD/JPY (Free view item: Correlation)
Good evening?
Recently, I have been taking a closer look at "correlation."
In the "Disassembly Handbook of Bollinger Bands," I also talked about how to view correlations within Bollinger Bands.
Correlation is effective in any analysis method.
In practice, I also look at correlations in Elliott Wave analysis and in reversal zones.
And in actual trading, I trade with correlation in mind.
It’s actually something quite important.
If I were to put the reason simply, it’s because everything in the world is interconnected somewhere.
Therefore, unless a country is completely isolated, nothing can be completely detached from correlations.
That said, even if you’re told suddenly about correlations, you may not understand how to view them, so if you’ve purchased the Bollinger Bands Disassembly Handbook, first look at the Bollinger Bands correlation.
If you haven’t purchased it, using MT4 or similar to display charts in a list and, more or less, just by instinct, please try to see,
It seems the dollar is strong~
Now there is correlation with the yen~
and take a look.
This is the chart arrangement I had arranged in a list when I shared it in the salon at that time. (Note: it has changed since then)
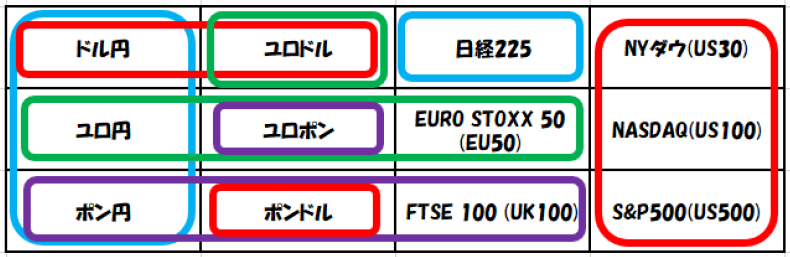
In the salon, we primarily dealt with currency pairs, so
blue indicates yen strength
red indicates dollar strength
green indicates euro strength
purple indicates pound strengthI was watching.
Of course, I received feedback saying, “Why not just look at currency strength without all this?”, but it was easier for me to see on the chart, so I did it that way.
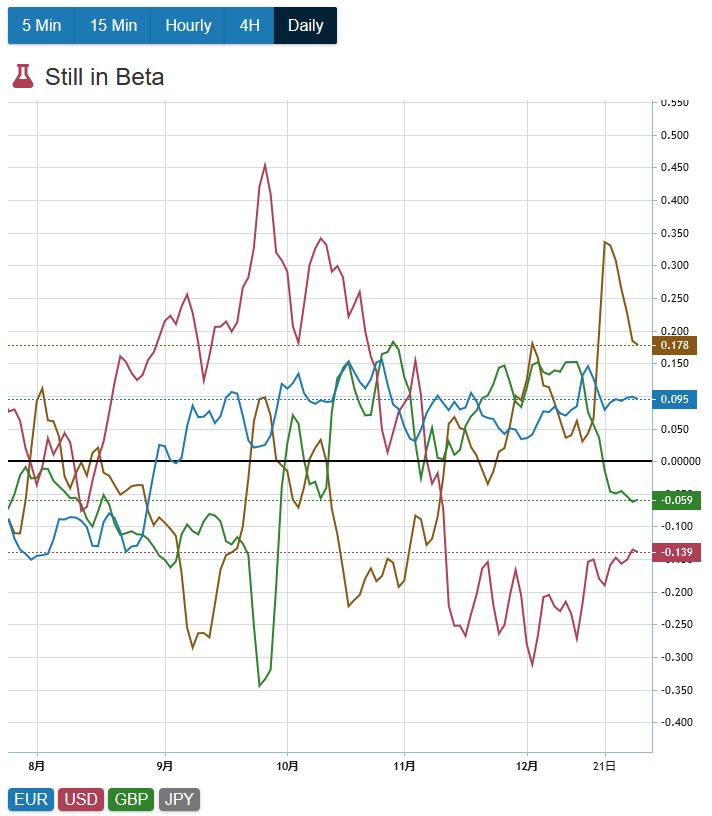
Are there well-known sources where currency strength is viewed, perhaps mataf?
https://www.mataf.net/en/forex/tools/currency-index
There are uses for correlation in indicators as well,
If you have some leeway, please take a look.
It may be challenging to start with everything at once, so it’s fine to begin with “those who have some leeway.”
First, it’s about thoroughly viewing a single chart, and then we’ll talk more, okay?
We have looked at correlations among the Nikkei 225, US 10-year Treasury yield, and US indicators (Dow Jones).
Today, let’s analyze Bollinger Bands while also looking at the dollar/yen correlation?
(Note: Environment assessment below is limited to members.)


