

December 21 (Wednesday): Nikkei 225 (Free viewing item: An indicator that allows for stop-outs based on market conditions)
Good morning ☀
I saw some TwitterChaos yesterday due to the decline,
and on the other hand, there were people who took the trouble to report their profits to me? (ˊᗜˋ*)*.•*
It’s wonderful, isn’t it?
I’m sure the person themselves must be happy, and I’m also happy myself?
Congratulations indeed ????????
Now, todayAbout Market Conditions and Stop-LossI had a question about this, so I’ll share one example.
If you’re wondering how to place a Protective Stop, please take this as reference?
Often people place Protective Stops very close to recent highs and lows…
This often leads to the position being stopped out by the Protective Stop, only for the market to move in the original direction afterward?
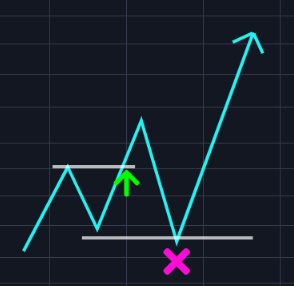
For example…
I entered on a breakout.
I place the Protective Stop at recent low + α.
Since it broke the recent low, I think I’ll cut losses…
But it suddenly shoots up dramatically ??
Why does it go up after clearly stopping out my position?
Haven’t you ever thought this?
“If it goes up, don’t go down!!! Damn it!!”
that’s the situation, isn’t it…?
(※?“FX Warrior Kurumi-chan”: If you haven’t read it yet, it’s worth reading as an FX manga ?)
Of course, I’ve had experiences like that many times as well, lol
Placing the Protective Stop at the recent high/low + α is also a form of “market condition,” but it’s somewhat insufficient?
In the salon,
“Do not place the stop-loss line where anyone can clearly see it!”
they taught, right?
Even so,“Stop-loss fixed at ○○ pips” is a worst way to place a Protective Stop that suits only youis far from ideal, but let’s go a bit further.
Consider placing the Protective Stop with current volatility in mind.
For that purpose,
use the indicator that can do market-condition stop-loss: ATR.
Have you ever heard of the indicator ATR?
This is the indicator that I introduced yesterday“The Turtles?”was using.
ATRis simply the “average volatility”.
In other words, you set your stop-loss line according to the market’s volatility.
ATR represents current volatility, so for example ATR = 30 pips,
30 pips has the potential to move up and down by that much.
Generally ATR(n) is multiplied by N to form the stop-loss line.
(N=2,N=3 are common. The Turtles used N=2. n means the average of n days. n = 20 days is recommended.)
I used 3× ATR(20).
In other words, if current volatility and range are 30 pips on average, place the stop at a distance of three times that, 90 pips.
This usually won’t trigger a stop-out; I place it as a final line.
If volatility is high, place it farther away; if low, place it closer to set the Protective Stop.
By adjusting the Lot according to this Protective Stop, you keep the same risk.
For those who are uncomfortable with high volatility, you can further reduce the Lot by a computed amount, making risk management easier.
In practice, using ATR to set Protective Stop makes the line feel quite distant.
So consider it together with Bollinger Bands for reference.
If the Bollinger Bands are flat, you can compare the outer ±2σ with ATR to assess.
Also, with expansions, comparing outer MA with ATR for consideration is a good reference too ??
There are many ATR indicators on TradingView, but
one indicator I introduced in the salon before is here?
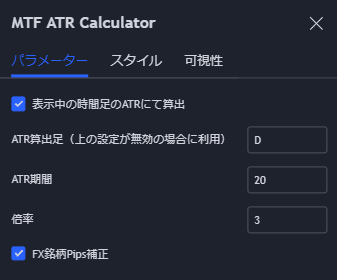
If you search for “MTF ATR” or “ATR Ca” in half-width (ASCII), you’ll find it.
(※Below, situational awareness is limited to members。)


