

December 14 (Wed): Nikkei 225 (Free viewing item: Check correlations in a list using MT4)
Good morning☀
The day’s erratic movement of the Nikkei 225 and US indicators yesterday…
Did anyone predict this?♂️
If you have a solid understanding of “Bollinger Band Explanatory Book,” you might have predicted it, I think?
*For those who missed it, there is a solution also in the question mark.
“What is this movementーーーー?”
If you thought that, please read it again!
【Strong Resistance Zone II】Next item【Correlation】As written, the movement of the price is that?
On TradingView, the number of charts you can display is limited by your paid plan.
So for those who can’t watch correlation that closely!
【Solution】
In that case, using MT4 is good!
There is no limit on the number of charts (too many can be visually hard to see, though?) and you can use it for free, regardless of which MT4 broker you currently use.
You can also use it with a demo account.
I display them in a list like this, as you can see?
(Note: since it’s a free viewing area, the infamous indicator is intentionally blacked out?♂️)
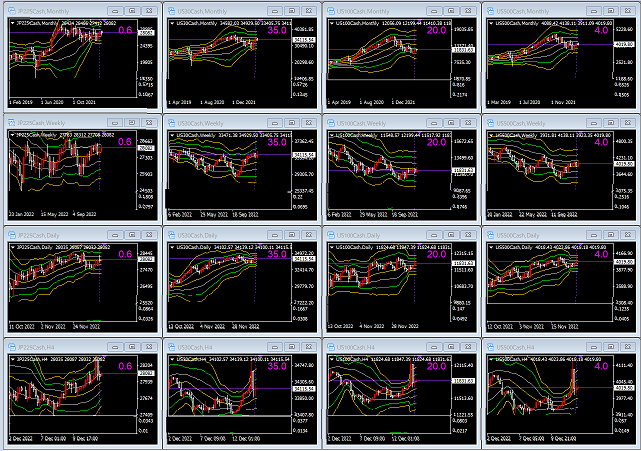
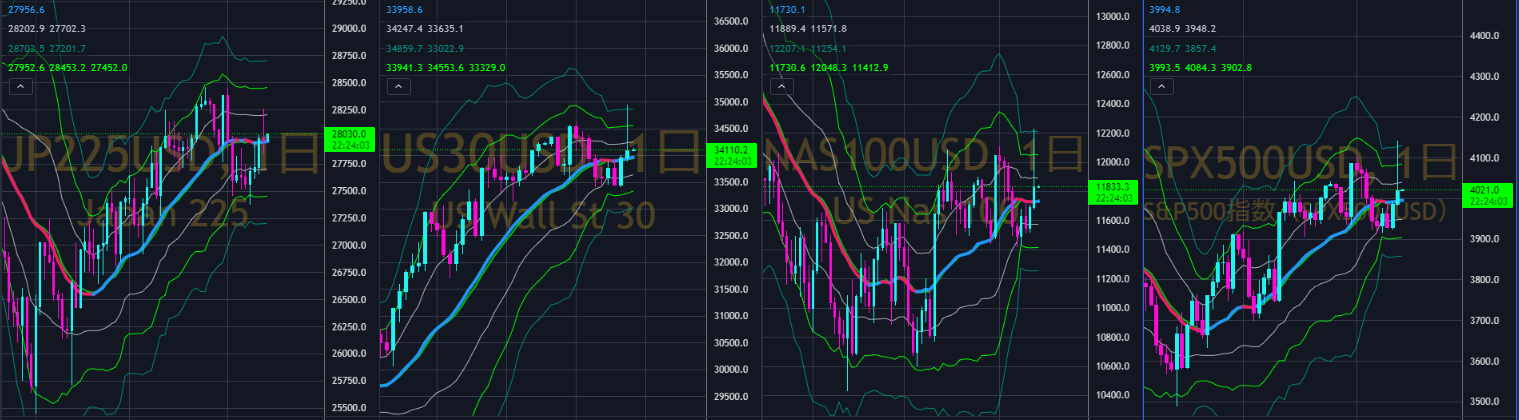
From the left: Nikkei 225, Dow Jones, NASDAQ, S&P 500
From the top: 【Monthly】 【Weekly】 【Daily】 【4-hour】
In this way, as a quick check, it’s free, and I find it easy to use and continue using it?
(Note: the following environment recognition is limited to members.)


