Current Analysis of USD/JPY: "End of the Adjustment Phase, Resuming Decline Toward 103.3" March 25, 2018
The adjustment period was short. The market tends to react well to bearish material.
March 25, 2018. USD/JPY Weekly
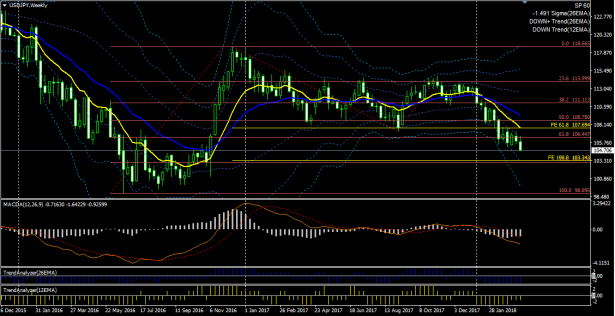
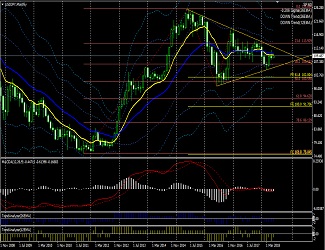
Looking at the weekly chart, after breaking through the congestion around the 61.8% Fibonacci retracement, a move toward around 78.6% (103.30 yen) has begun. In relation to the two EMAs, in the short term it is not strong, but in the mid term it is strong. In the previous decline, it has generally traded between -1σ and -2σ. -2σ has reached the Fibonacci retracement 78.6%, making 103.30 yen a realistic target. If the short-term outlook were stronger, we might expect to reach the target by the end of this week, but since that is not the case, a gradual drift downward is a plausible view.
March 25, 2018. USD/JPY Daily
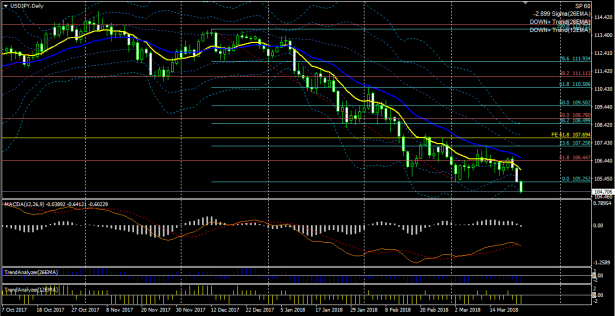
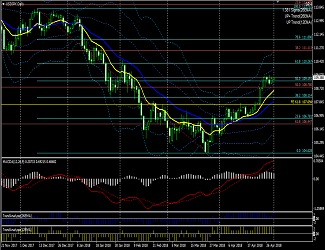
With the bearish candles on Thursday and Friday, the 26 EMA Bollinger Band has started to widen, and MACD has also undergone a dead cross. At present, the decline is strong in both the short and mid term. Three consecutive bearish candles have already formed since Wednesday. In the USD/JPY market, it is unlikely to see such a sequence continue to five or eight consecutive candles, but considering the weekly bearish candles and the prior large three-candle decline in mid-February followed by a period of consolidation, it may be prudent to beware of a continuation of a strong downtrend.
March 25, 2018. USD/JPY 4-hour
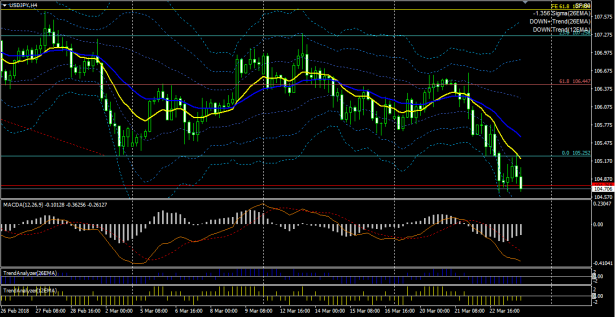
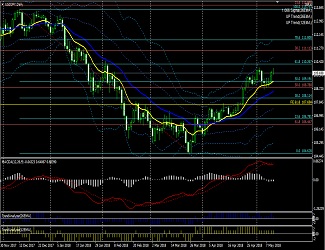
In the 4-hour chart, on Friday the price was stopped twice near 104.7, and then returned to 104.7 again before the week ended. The downward momentum is strong in the mid term but weakening in the short term (OsMA is rising, and the Trend Analyzer shows a normal decline).
From a wave perspective, one can view the high that reached the blue Fibonacci retracement 23.6% as the starting point of the directional wave, or one can view the same starting point as the beginning of a diamond triangle. Either interpretation places this within the internal structure of Wave 5, but if interpreted this way, it would imply Wave 4 is a short, simple wave, which feels a bit odd.
↓ MACD used in the charts above.
Display MACD, Signal, and OsMA, with four alert options that can be set.
MACD (four alert options, capable of sending email)
↓ The template and indicators used in the above chart. Technical indicators can also be purchased individually.
MACD (four alert options, capable of email) trading system

Stochastic (alert, email capable) | MT4 indicator that can send alerts and emails for cloud breakouts, etc. |
↓ Now available on GoGoJang.
EA that profits by simultaneously trading both trend-following and counter-trend strategies
This article is an excerpt from the blog “When you visualize it, the market becomes a magic wand that can strike.”