
Forecast for USDJPY and GBPJPY (Elliott Wave Calculator & Points & Figures & MACD)
0.002% Framework P&F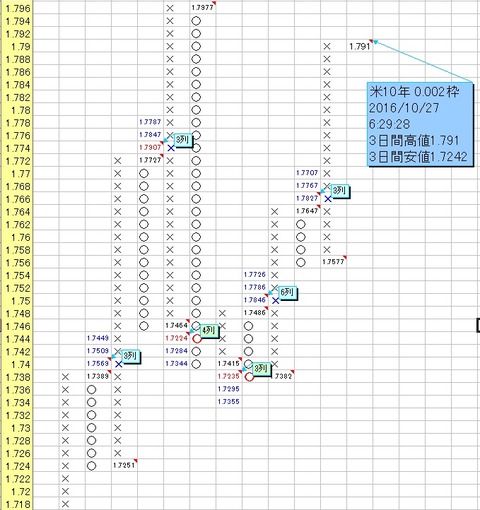
0.1 Yen Framework P&F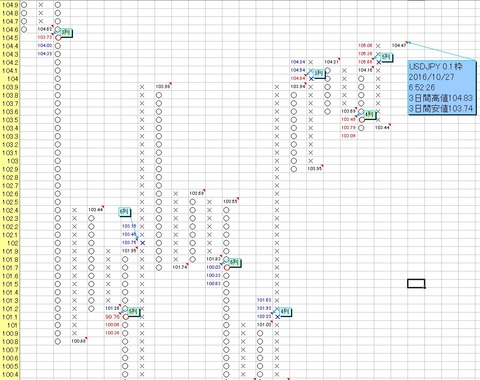
MACD
Blue line = MACD, pink line = MACD signal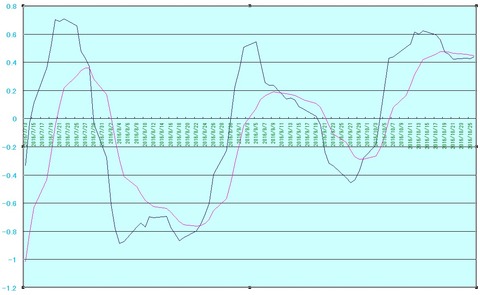
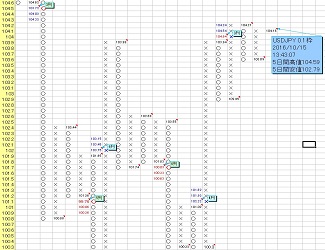
As stated above, USDJPY shows a bullish signal on the 0.1 yen frame Point & Figure, but the situation is not very favorable.
There is normally a high correlation between the USDJPY rate and the U.S. 10-year Treasury yield.
Recently, the U.S. 10-year yield rose sharply, and USDJPY rose sharply as well.
In the P&F of the U.S. 10-year yield, an upward signal lit up, but as mentioned above, it reached the target by last night.
Also,comparatively few false signals 8/17/9 MACD shows a drop signal, is also forming().
Since there is little room for the U.S. 10-year yield to rise, there is little room for USDJPY to rise, and short-term upside may be around the early 105 yen range.
However,U.S. 10-yearTreasury yieldappears to still be in an uptrend based on its chart pattern, so even if USDJPY retraces temporarily, the uptrend is likely to continue.
By the way, you can view the chart of the U.S. 10-year yieldhere.
Next, GBP/JPY
0.1 Yen Framework P&F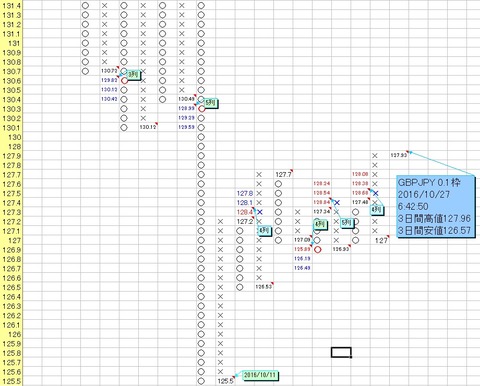
![]()
As above, the GBPJPY 0.1 yen frame P&F also showed consecutive upward signals.
Point & Figures (Top Secret Chart) Screen Introduction
If you want to learn more about Point & Figure (Top Secret Chart)