
Current analysis of the USD/JPY: "In the daily chart, the fourth wave of the Elliott Wave is in progress" March 18, 2018
March 18, 2018 USD/JPY Weekly
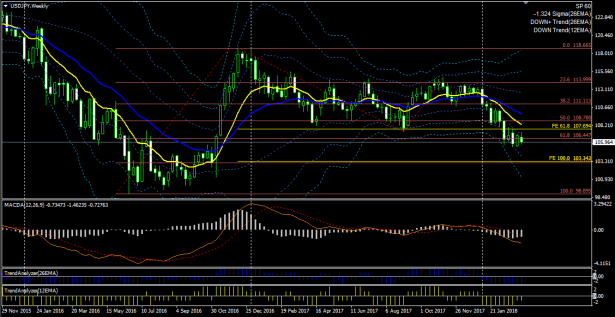
In the weekly chart, a downtrend is evident, but the last four candles have overlapped and moved sideways, indicating a time correction phase.
Nevertheless, price action is detached from the 12 EMA, suggesting that the downward momentum remains.
With the 12 EMA and OsMA, the downward momentum is weakening, but the 26 EMA and MACD line indicate a strong decline, suggesting a short-term correction is underway.
Looking ahead in the longer term, the market is likely to target around 103.3 where the Fibonacci retracement 61.8% and Fibonacci expansion 100% coincide; in the near term, however, the probability of continued correction is high until the candles approach or touch the 12 EMA.
March 18, 2018 USD/JPY Daily
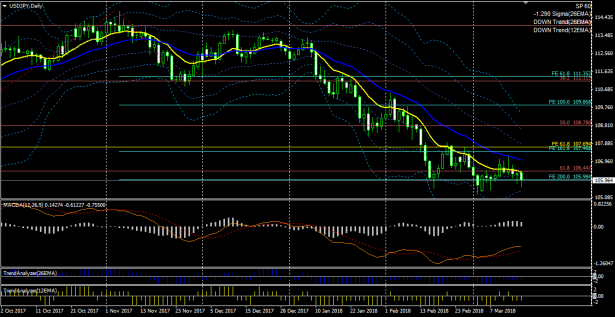
On the daily chart, price touched the 26 EMA and turned, approaching the weekend while aiming for a new low. It may continue to test the lows, but there is also a possibility of forming a pennant with higher lows and lower highs.
The MACD line formed a bottom in mid-February and has since been rising slowly. The narrowing of the 26 EMA Bollinger Band suggests that the downward momentum is decreasing.
From the November high, Elliott Wave directional movement is underway. If you draw Fibonacci expansions on this wave, we are currently around the 200% level. It is unclear whether the third wave has ended and the fourth wave is starting, or if we are still in the third wave. The third wave may extend further, but considering MACD divergence, it is likely that we have already entered the fourth wave, implying a corrective wave centered around 106.
March 18, 2018 USD/JPY 4-Hour
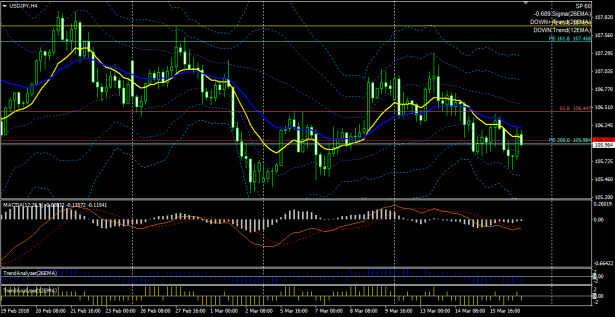
On the 4-hour chart, there is no clear directional movement, indicating a waiting-and-see market.
Looking at the recent two weeks of upswings and downswings, the internal overlaps create a cluttered swing pattern with no clear direction.
↓ MACD used in the above chart.
Display MACD, Signal, and OsMA and set four types of alerts.
MACD (four alert types, email capable)
↓ The above chart template and indicator set. Individual technical indicators can also be purchased.
MACD (four alert types, email capable) Trading System

Stochastic (alert and email capable) | MT4 indicator that can send alerts by cloud, etc. when Cloud turning occurs |
This article is an excerpt from the blog “Look and Float, and the Market Becomes a Treasure Tool.”