Current analysis of USD/JPY: “Is this a correction within a bottoming zone?” March 11, 2018
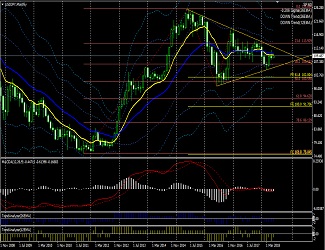
March 11, 2018, USD/JPY Weekly
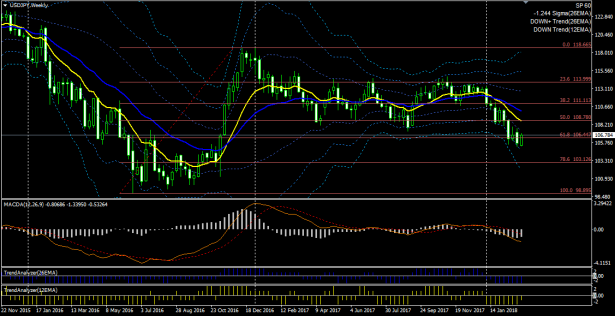
In the weekly chart, the downtrend is continuing. The candlesticks are moving away from the 12 EMA and are between -1σ and -2σ, indicating a normal-strong downtrend. The +3σ of the Bollinger Band has started to move sideways, while -3σ is pointing downward, suggesting the downtrend will continue for a while. It has paused near the 61.8% Fibonacci retracement, but in the first half of this year, it may move downward?
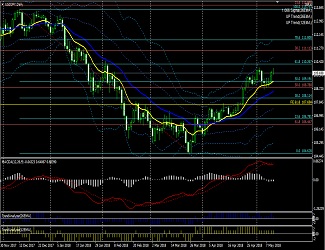
March 11, 2018, USD/JPY Daily
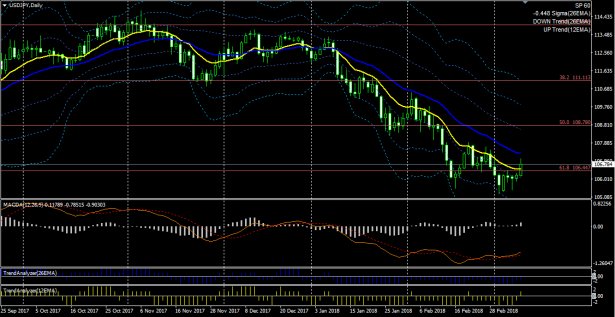
Friday’s close was above the 12 EMA, and the downtrend has weakened. From the Bollinger Bands perspective, it closed above -1σ, suggesting a loss of trendness. However, although the new lows have stopped being updated, it has not formed higher highs, so the downtrend continues. The downtrend persists, but the MACD line is gradually rising (divergence) is continuing.
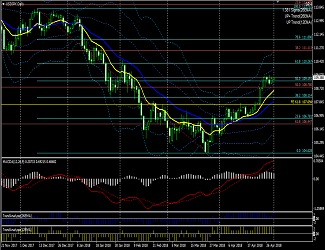
March 11, 2018, USD/JPY 4-hour
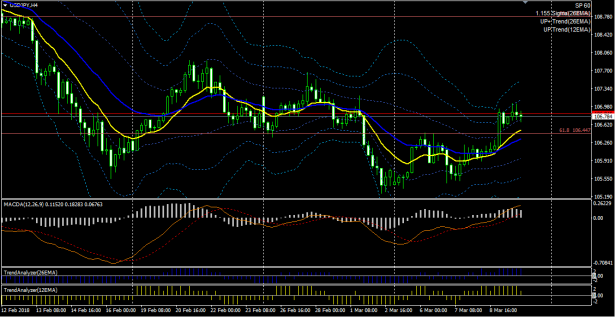
In the 4-hour chart, from the March 2 low, a higher low and higher high forming an 'N' shape indicate a short-term uptrend. The EMAs cross and the MACD line is positive, which also indicates an uptrend. However, this N-wave seems to be a corrective wave to the previous decline. This N-wave is likely to continue with another drop and rise, but the key question is whether the downtrend will end by surpassing the February 21 high.
↓ MACD used in the above chart.
MACD, Signal, and OsMA displayed; four alert types can be set.
MACD (four alert types, email capable)
↓ This is the template and indicator set for the chart above. Individual technical indicators can also be purchased.
MACD (four alert types, email capable) Trade System

Stochastic (alert, email capable) | MT4 indicator that can send alerts and emails for cloud/waves/turns, etc. |
This article is an excerpt from the blog “The market will become a gnarled copper if you press it with your will.”