
One-Click 225 Training Support Page
If you are considering purchasing the product, you can purchase from here.
Upgrade for purchasers is free ⇒Download
※By downloading or launching this product, you agree to theTerms of Use.
If you encounter license errors during use, please refer tothis.
Fast skip
Support for LINE specification changes
AI judgment
Individual scrolling of synchronized charts
Enclosed keyboard operation
Distribution of object synchronization tool
Reset + TS addition,
Add daily/weekly/monthly history, 10/100, PROFIT, PIPS/trade to history,
Change font of messages
Change saved date to chart date/time
▼ 2024-09-09 v8.16
Error page display, enhanced masking of synchronized charts, added minimize-on-start, adjusted sync bars, BE line swap, deletion of stop order in settlements, added start button at launch, downloader fixed, one-click SA warning handling, other bug fixes, parameter and color adjustments, etc.
▼ 2024-07-15 v8.01
Added line thickness parameter,
Added auto-split orders
Fixed message for margin and currency pair mismatch
Added Support Assist,
Added entry timing color bars
Added spread to SL calculation
Added time-leap function
Added resume functionality from last time
Added historical verification viewer
Added strategic close
Added Flexible Trailing Stop
Separated TP/TS processing and SL/TS button
Double-click to clear messages
Added keyboard settlement
Bundled incentives such as Indices
▼ 2023-11-12 v7.60
Added button to move to the next bar
▼ 2023-10-20 v7.51
Added color to close time messages,
Clicking date in history shows results
Other bug fixes▼ 2023-09-29 v7.50
One-Click Auto Arrow Trade [AutoArwTrade]support
Added buy/sell settlement in signal linkage
Changed display for P/L and size in history
Accelerated signal linkage
Added credit to P/L calculation
Server orders add initial only
Set TP/SL line at minimum RR to 0.1
Order TP/SL line display also when executed
Added parameter for initial position of control box
Auto-generation of active synchronized charts▼ 2023-04-22 v7.30
ASP-friendly comments▼ 2023-04-12 v7.281
Activation of synchronized charts
Save button for preset charts
Fix jagged position bars
Display, comments, etc. fixes▼ 2023-03-11 v7.11
Added WebRequest for license authentication,
Compliance with ASP regulations,
Auto NOPIN button
Font size scaling
Added speed list
Support for multiple signals,
Slack notifications September 16, 2022 v7.010 bug fixes, etc.
▼ 2022-09-04 v7
Added limit-entry orders
Added automatic risk calculation
Added profit percentage of margin (risk%)
Displayed daily P/L %, trade history display
Display of position information
Added risk-reward
Changed display of position triangles
Automatic daily aggregation images
Right-edge shift for synchronized charts
Added corrected risk% calculation
▼ 2022-04-16
Added reset flag for TP/SL/TS on full close
Fixed NONE triangles and other bugs
▼ 2021-10-15 v6
Immediate position display on entry
Added invalid values for tool control TP/SL
Rejection for negative entries
LINE, Discard notifications
Change triangle colors to intermediate BUY/SELL
Added initial parameter values
Added message display area for errors, executions, etc.
Reduced load during speed control
Support for some commission-bearing accounts
▼ 2021-06-02
Added forced loss-cut line
Prevent opening the settings screen when repeatedly tapping
TP/SL line drag & drop support
Added sub-panel
Added individual settlement, partial settlement
Support for active preset charts changes
Added compact mode
Signal linkage (index) parameters
Signal linkage (object) close added
Signal linkage included with free version of indicator
ON/OFF switching for signal linkage
Added license authentication
▼ 2020-08-08 addendum
Signal tool linkage
Automatic saving of trading images
Change control box to preferred color
Break-even line
TP/SL lines
Notations changed to PIPS
Parameter整理
PipsGrid bundle for drawing lines in PIPS units
Position display on synchronized charts
SL standard and trail
Auto NPN on SL
Line as a percentage of funds
▼ May 25 addendum
Mocked俺…
Auto trailing OFF/ON toggle
▼ May 1 addendum
TP/SL set to 0 disables at order time
To maximize profits, enable trailing on take-profit order
Add PIPS display for profit
Show negative values in red
Add currency name to ALL and RESULT in P/L
▼ March 27
Show current spread (including real version)
Display order and bid/offer as a triangle for quick reference
Add order and stop order lines (including real version)
Add MA, BB, SAR to trailing stops
Add time display with time difference and daylight saving time settings
Add synchronization rate adjustment for other charts
Add dedicated templates
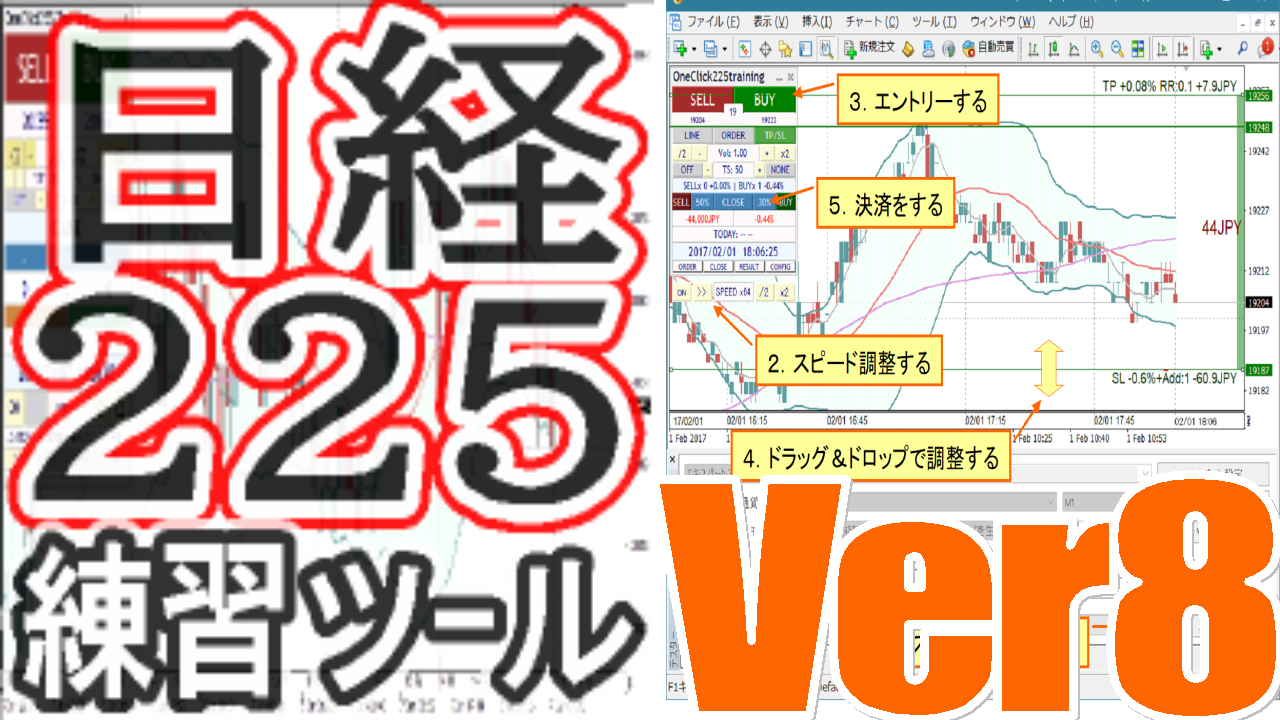
■What’s included
One-Click 225 Training is a trading practice tool that uses MT4 and supports Nikkei 225 futures/minis.
In addition to basic features like speed control, auto setting of take-profit and stop-loss orders, and limit orders, it offers replay functionality, signal tool integration, partial settlements, automatic risk calculation, history saving, automatic saving of trading images, daily aggregation, time-leap, restart, and rich display features, making it a comprehensive practice and testing tool.
From daily practice to tool testing and technical analysis, it can be used for various purposes.
- What’s included
- Introduction
- Operations & Parameter settings
- Detailed features
- Sub-chart synchronization settings
- Link with signal tools
- Indicators included
- Troubles & Tips
- If you’re stuck
■Introduction
Since it is not specified where you obtain it from, please install your preferred MT4.
Note: Using the same environment may lead to unforeseen problems, so it is recommended to prepare a demo account separate from the real trading account you use for trading.
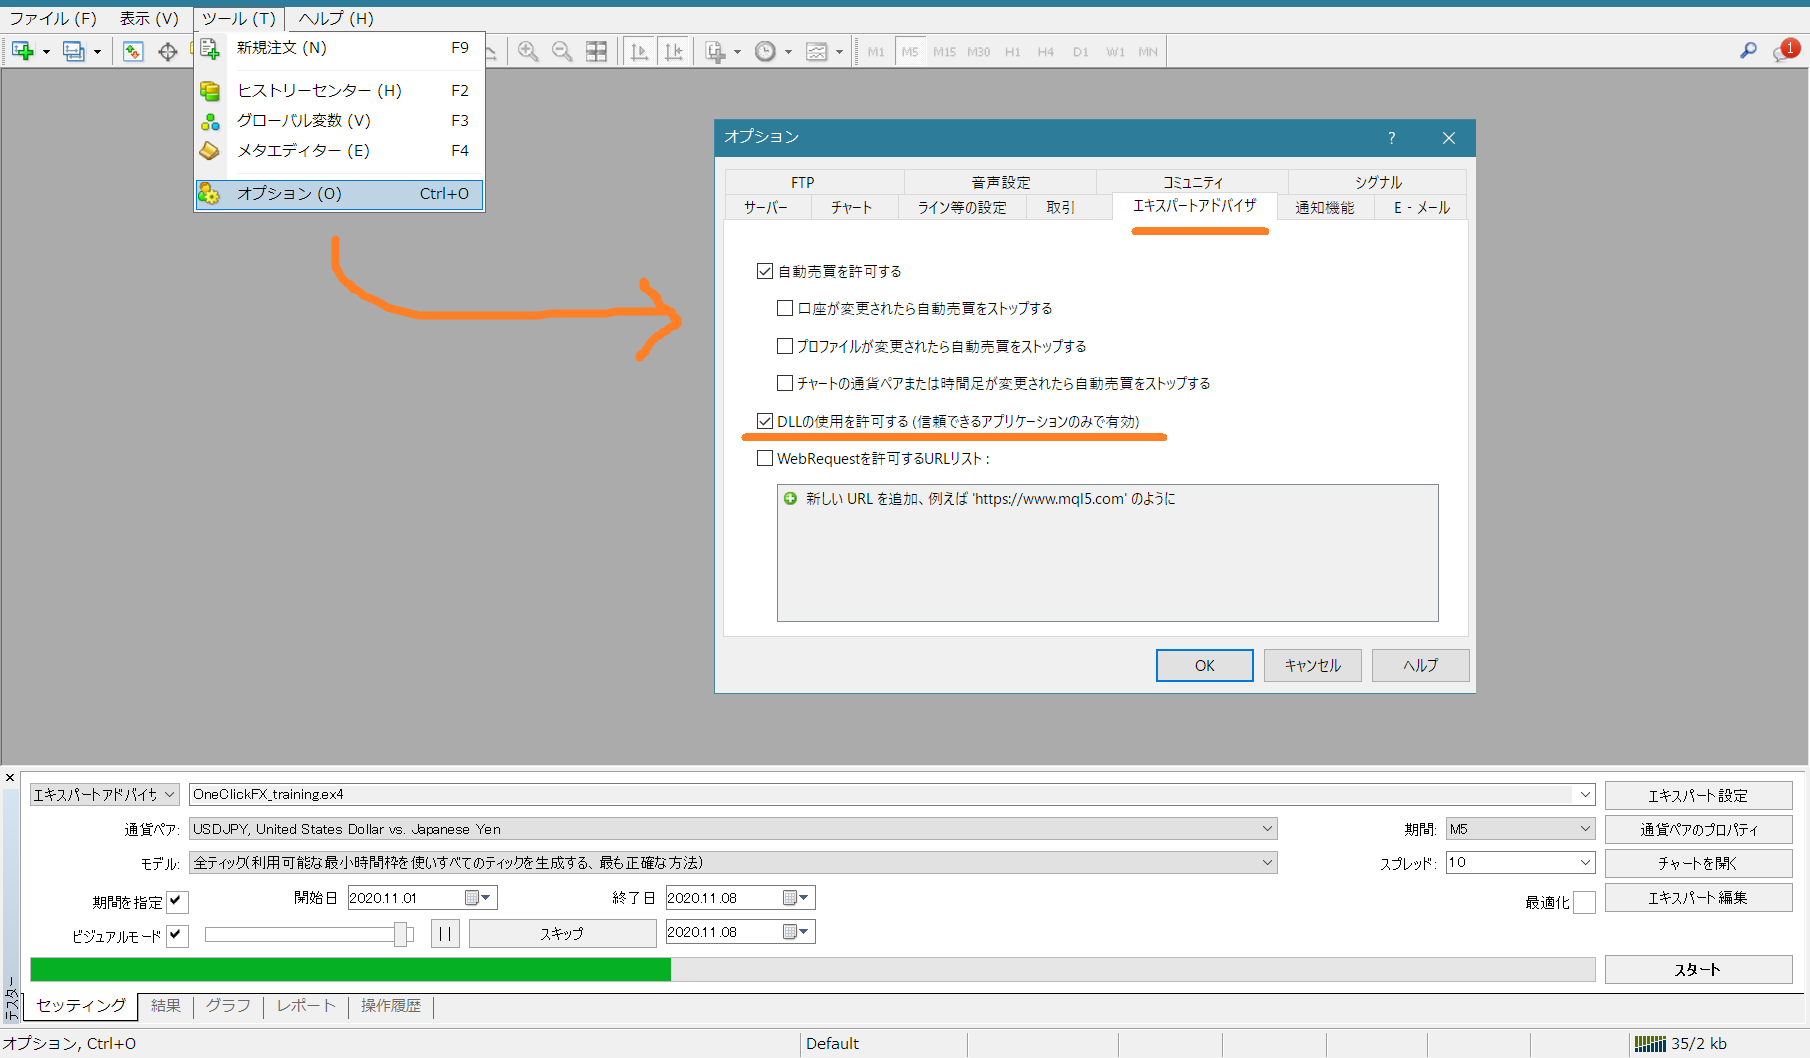
Please check the DL permission (details arehere)
Preparation for authentication
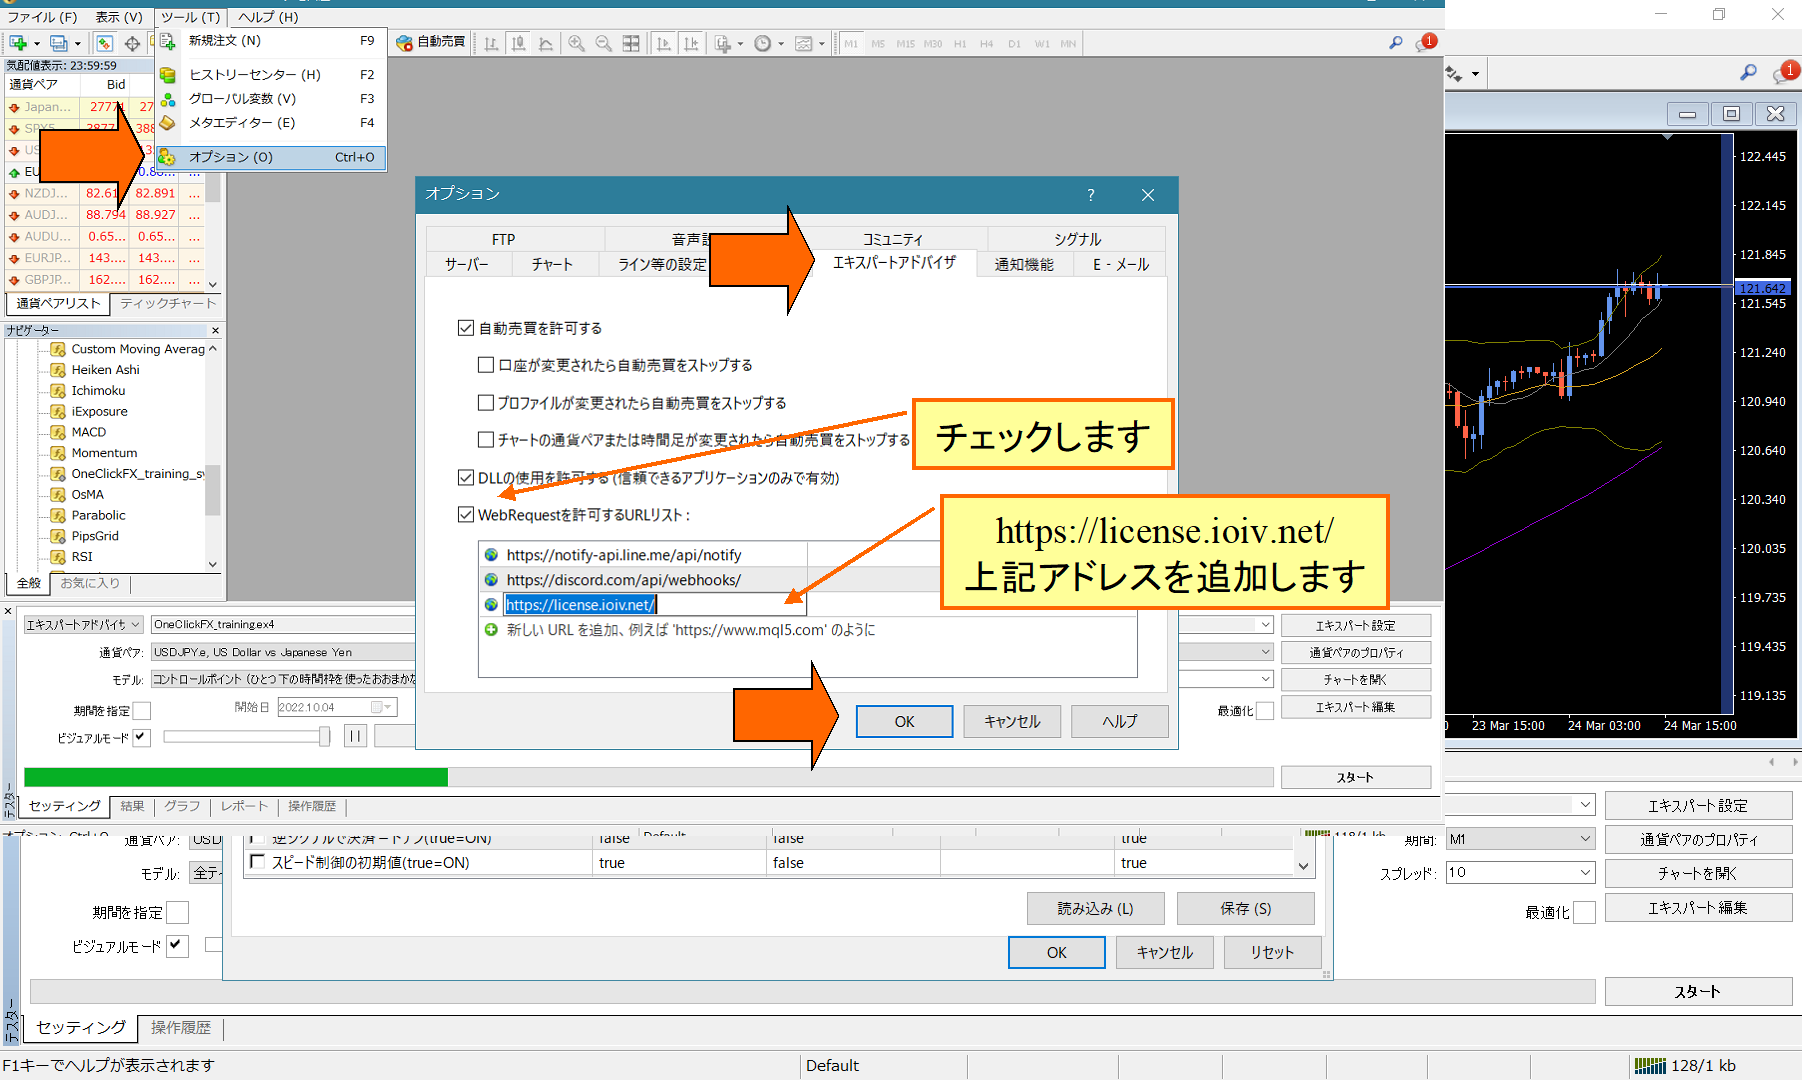
If authentication issues occur due to security tools, please add to WebRequest.
Select Tools => Options in the MT4 menu, open the Expert Advisors dialog.
Check the URL list that allows WebRequest, and add the new URL https://license.ioiv.net/ and press OK.
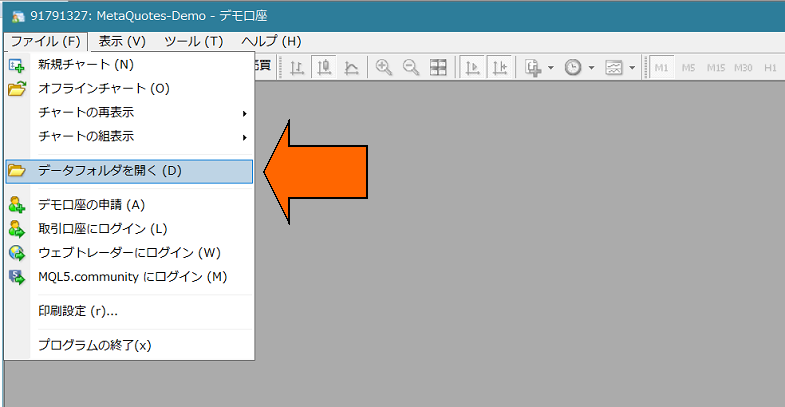
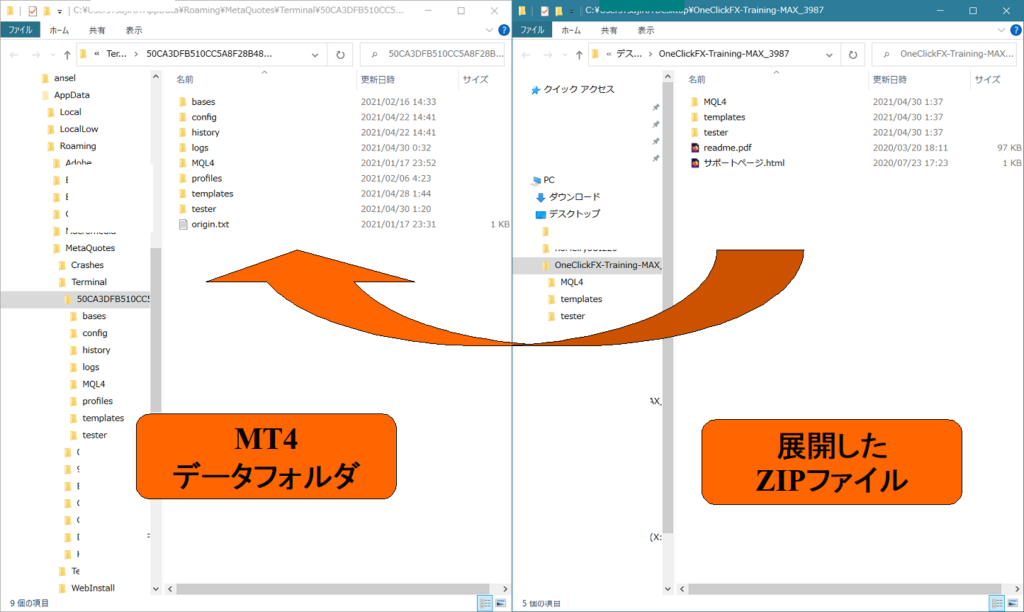
1) From MT4, choose Open data folder.
2) Overwrite all MQL4, templates, tester folders of this product into the data folder.
Launching One-Click 225 Training
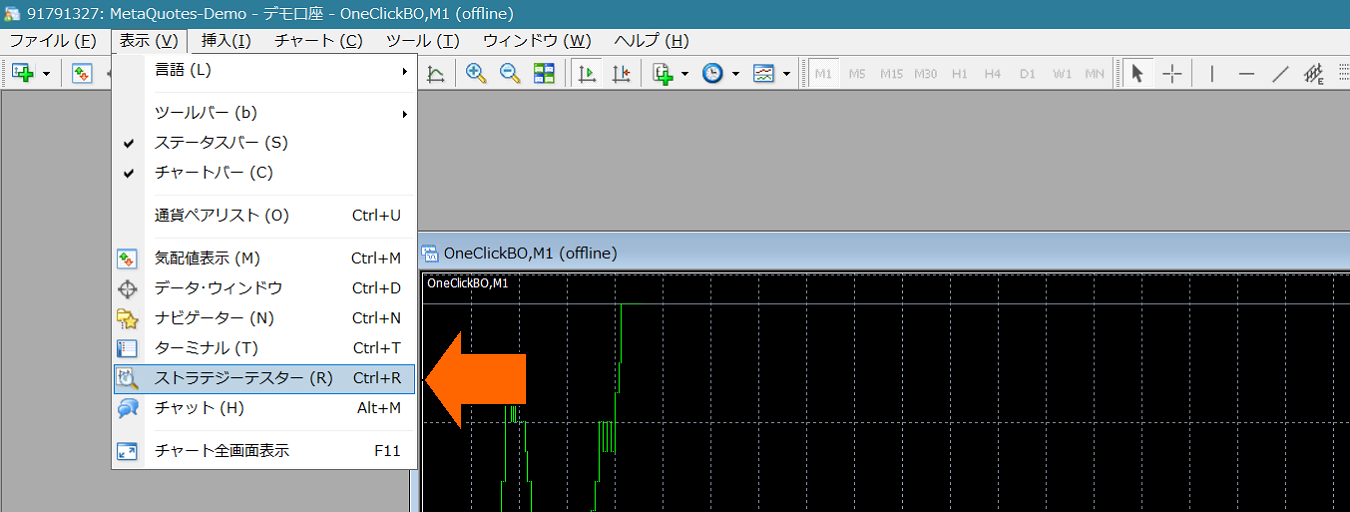
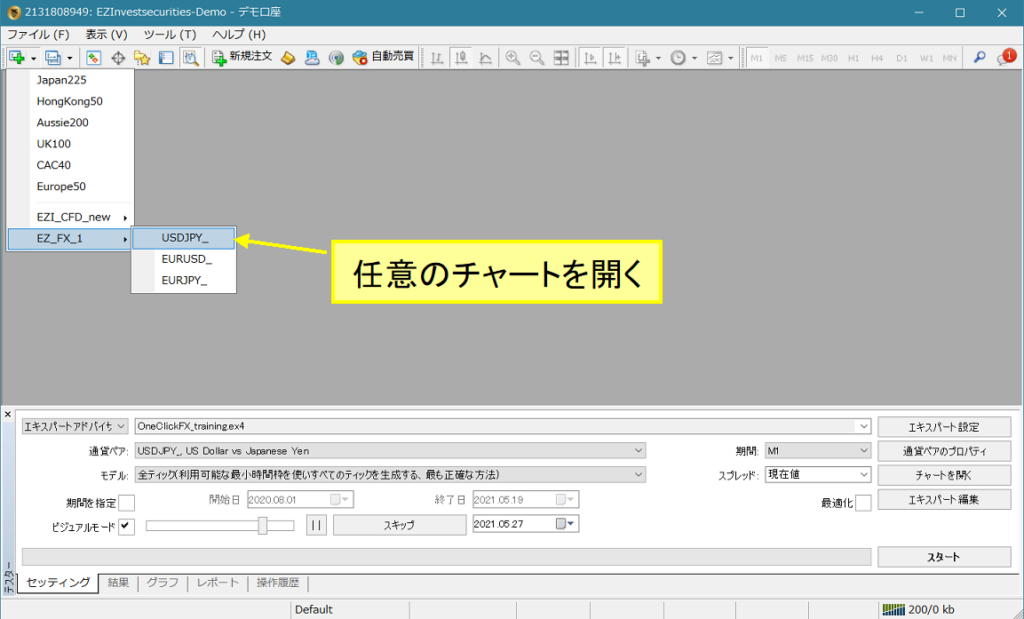
4) Open Strategy Tester window.
5) In Strategy Tester, choose Expert “OneClick225_training”, any currency pair,Model is “Control Point” (for scalping, etc., use all ticks), check Visual Mode, uncheck Optimization. Move the speed slider to 31 or 32.
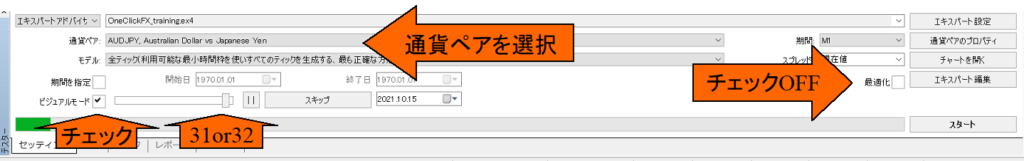
※If Visual Mode or such is not shown, see here=>MT4 Tester visual mode, speed slider, period not displayed
6) [Important] From Expert settings,open the parameter input and enter your GoGoJungle member ID, then OKand press. (Other parameter information will be stated later). If some time has passed since purchase or you changed your email address, please inform us via the form at the bottom of the page. Using an unknown address may constitute misuse.If you authenticate with the One-Click FX Downloader, you do not need to enter your email address.
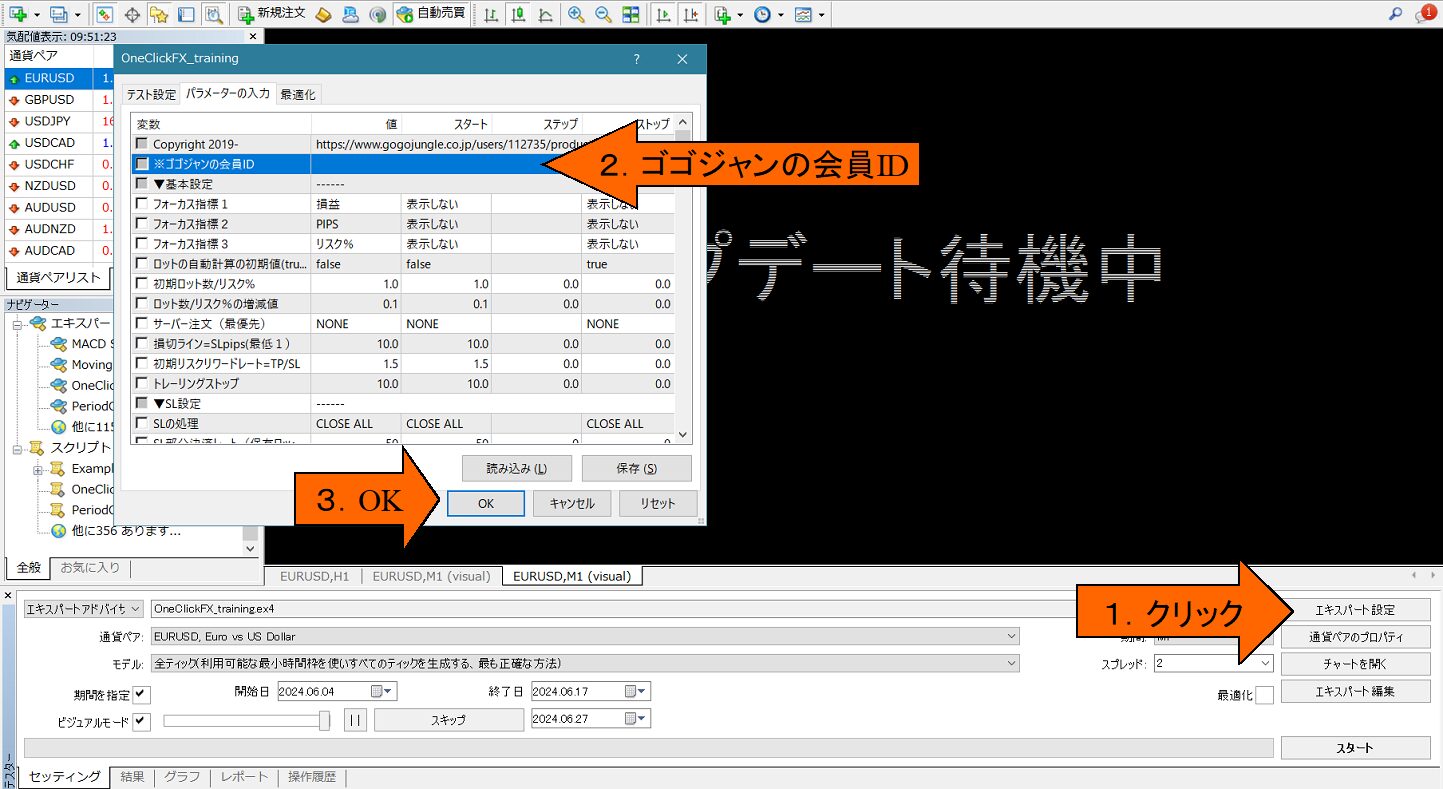
7) In the tester window, press the Start button at the bottom right (the image shows the Stop button)
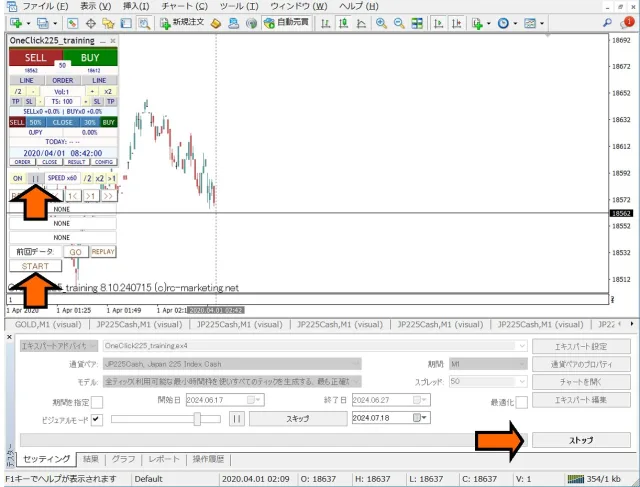
After showing “Waiting for update,” the chart screen will appear. If license errors occur, please re-check your email address. Press Stop to halt. From the control panel at the top left of the chart, press the Start button or the Pause button in the control panel, then begin.
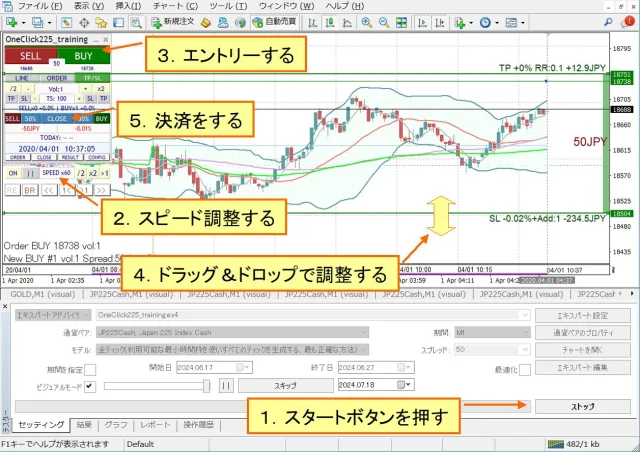
This will run with the default settings. Press Buy/Sell and the settlement button to verify operation.
If it stops immediately after starting, please check the error items in the operation history tab
If you want to practice trading easily first
Change of standard charts during tester operation
Three standard charts are included.
・OneClick225_training: Standard chart automatically applied at start. It includes original chart colors and Bollinger Bands, moving averages, PipsGrid, economic indicators, and JST time display indicators.
・OneClick225_training_core: Simple content with original colors and Bollinger Bands only.
Apart from the above, you can freely change the standard preset charts or your own charts by right-clicking > Preset Chart.

Convert margin to Japanese Yen
From the Expert button, open the test settings, and in the initial margin dropdown, directly input “JPY.” If left as is, funds will decrease, so add two zeros to the value.
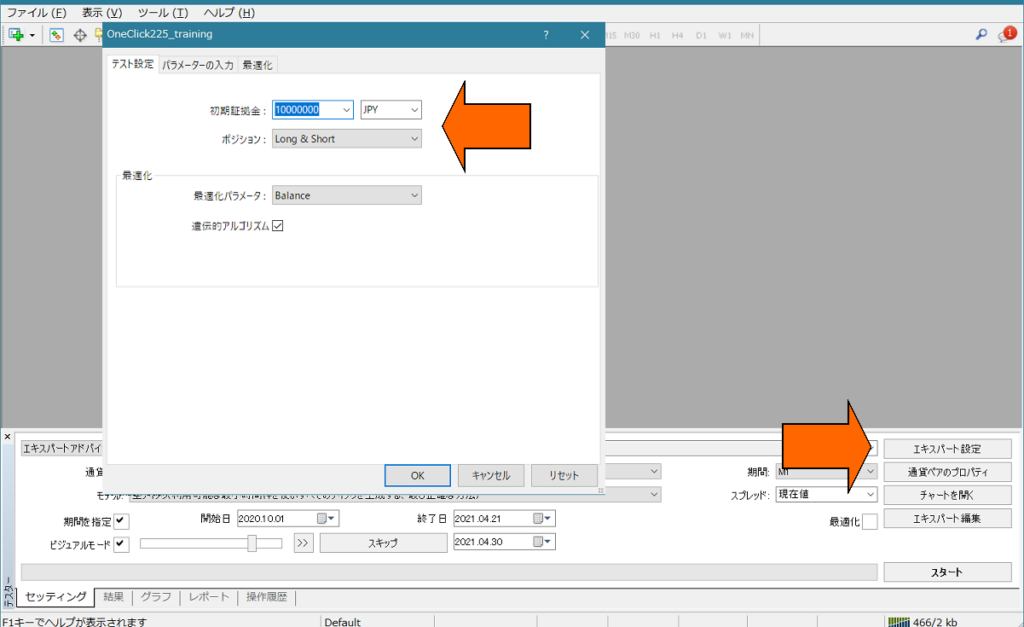
Depending on the broker, orders may be stopped immediately if the currency pair is not in Japanese Yen. In that case, use the margin appropriate for the currency pair.
For details →MT4 Strategy Tester: Set margin currency to Japanese Yen
■Operations & Parameter Settings
How to use One-Click 225 Training
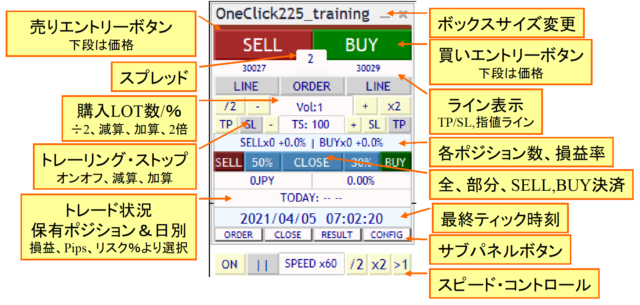
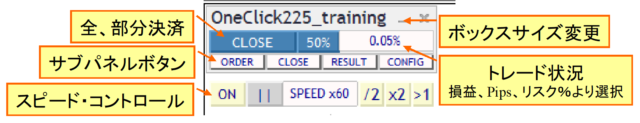
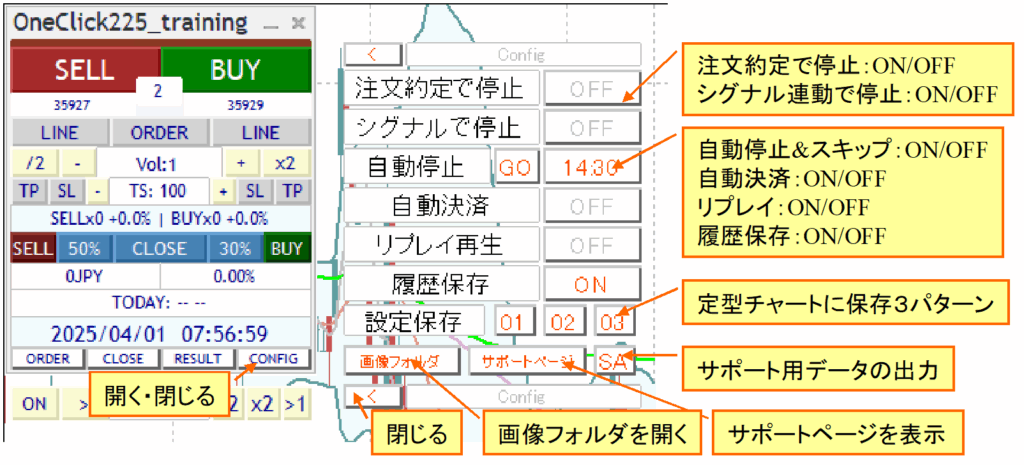
Main panel (normal mode)
Focus mode
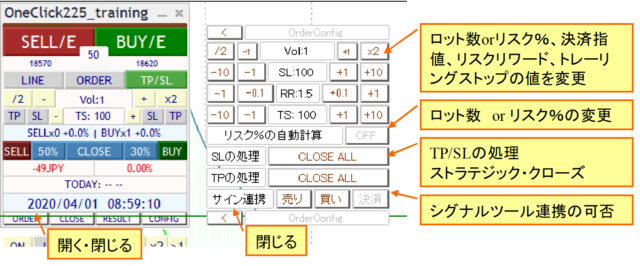
Sub panel for orders
Sub panel for closes
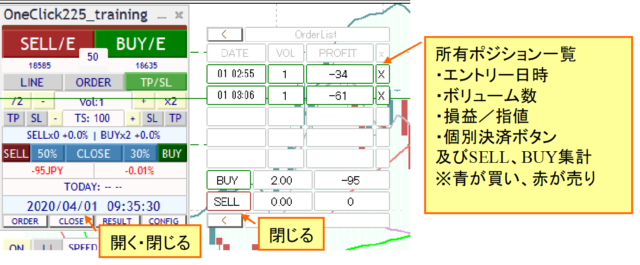
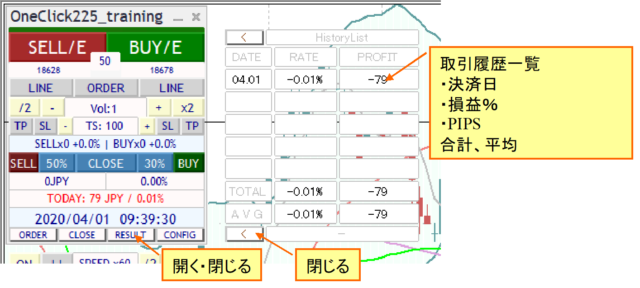
Sub panel for history
Other sub-panels
Speed control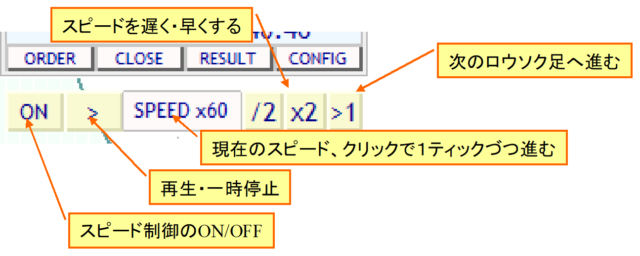
Pause and resume and restart save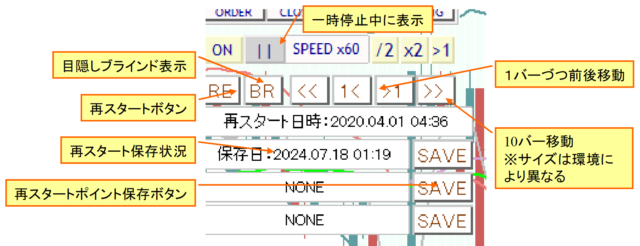
Display contents at start, normal start, restart, replay
OneClick225_training parameter settings
| Item | Description |
|---|---|
| GoGoJungle member ID | Enter GoGoJungle member ID for license authentication. Available only to purchasers. |
| Focus indicators 1,2,3 | You can select three indicators: profit/Loss (P/L), PIPS, and risk %. Indicator 1: left of the control box, Indicator 2: right of the control box, Focus mode, Indicator 3: center at the right edge of the chart (NONE to hide) |
| Initial value for automatic lot calculation | If you auto-calculate lots from risk %, true |
| Initial lots / risk %, increment | Set the initial value and increment for lot size or risk %. |
| Server orders | Choose whether to place TP/SL on server or SL only. The first TP/SL and first SL are set only at the initial order; changing TP/SL lines afterwards will not affect the order contents.If server orders are ON, theStrategic Close |
| Stop loss line = SLpips (minimum 1) | Specify the initial PIPS from the break-even line to the settlement stop line. This value excludes the spread. The settlement stop is the specified stop line + spread. |
| Risk-reward | Specify how many times the difference between the break-even line and the settlement stop line should scale the initial TP value. For example, if SL is 100 and risk-reward is 1.5, the initial TP value is (break-even line to (100 pips + spread)) × 1.5. |
| Trailing stop | Trailing stopis an automatic upgrade of profit protection via the tool control. Specified in pips. |
| ▼ SL settings (Stop-Loss) | |
| SL handling | If the settlement stop is reached, theStrategic CloseStrategic Closeprocessing is specified. |
| Partial SL rate (holding lots %) | Specify the partial settlement percentage in %. |
| SL trailing stop type | Trailing stoptype of trailing stop to use. |
| ▼ TP settings (Take-Profit) | |
| TP processing | If TP is reached, specify the processing ofStrategic Close. |
| TP partial settlement rate (holding lots %) | Partial settlement percentage |
| TP trailing stop type | Trailing stoptype. |
| ▼ Individual settings | |
| When orders are placed and executed, turn ON the TP/SL line | When you press the order button, the TP/SL lines are set to their default values. Even if you turn TP/SL lines OFF after placing a limit order, they will turn ON when the order executes. |
| Strength of Entry Assist | Entry AssistSettings. The default is disabled. |
| Forced settlement from keyboard input | Entering a specific key performs all settlements. Default is disabled. You can settle using any combination of SHIFT+CTRL+ALT. Depending on keyboard layout, supported keys may vary, so please try beforehand.Increasing playback speed is restricted when used. |
| Maximum number of positions | Maximum number of positions you can enter. Some brokers also limit this. Zero means unlimited |
| Maximum size per position (zero for unlimited) | Automatically split order size at entry. |
| Use ASK line | You can simulate BID with ASK line. If false, adjust for spread and display a normal line. Note that large spread fluctuations may cause errors. |
| Acceptable slip page | Specify acceptable slip in points |
| PIPS=>Points conversion factor | Specify the value to convert PIPS to points. Usually zero for automatic. For CFDs, adjust multiplier per broker. |
| ▼ Speed settings | |
| Initial speed index | Index in the speed control speed list at which to start. |
| Speed list | Comma-separated speed multipliers. 60 means 1 second = 1 minute, 3600 means 1 second = 1 hour, 14400 means 1 second = 1 day, up to 604800 (7 days). However, the fastest speed cannot exceed the Strategy Tester’s maximum. If speed control is OFF, the speed is the tester's maximum play speed. |
| Initial value for one-time pauses at order execution | Pause in speed control at execution. Playback and ON/OFF control can resume. |
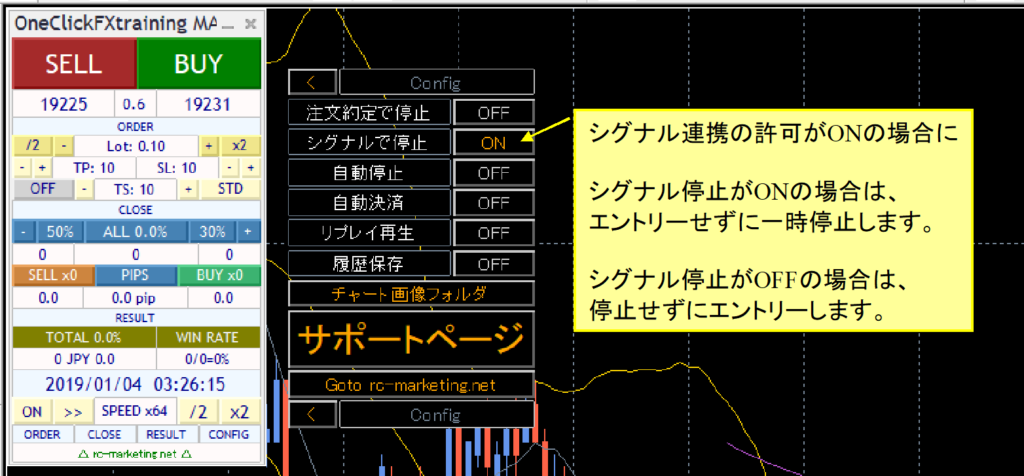
| Initial value for one-time pauses at signals | When a signal activates, pause in speed control without entering orders. No orders are placed; assess situation, then press play or ON/OFF for speed control. |
| Forced settlement time Initial forced settlement time |
Change as needed. If there are positions, settlements occur at the specified time and pause. If the initial value is true, ON. |
| Auto stop time Initial value for auto stop |
Change as needed. The chart will automatically stop after the specified time. Works on charts with H1 or below. If initial value is true, ON. |
| Replay start value | If initial value is true, ON. |
| History save initial value | If initial value is true, ON. |
| GMT difference with connected server Whether Daylight Saving Time is used |
If MT4 displays as is, continue. To set to JST, adjust to a two-hour difference and enable DST (depends on the connected server, please check). |
| Display of final time | Show the last tick time in the control box. If server time difference is adjusted, the adjusted time is shown. |
| Trading image capture Image size width/height |
When filled, configure whether to capture images on execution, or daily. After tester ends (stop button pressed), open the folder where images are saved. Images are overwritten each time, so copy to another location if needed. |
| Show trade history marks | Display MT4 standard entry and settlement triangle marks and lines. |
| Specify the maximum number of AI output bars. *Number of candles | |
| Specify the number of margin bars for AI output data. | |
| While linkage is active and you hold a position, if a signal in the opposite direction occurs, choose from: place hedge orders as is, close current position, close and place order (double), or do not act. | |
| Initial permission for Buy signals Initial permission for Sell signals Initial permission for close signals |
Set initial ON/OFF for signal linkage ON (true) or OFF (false). |
| ▼ Signal tool linkage (object) | |
| Buy signal object name Sell signal object name |
Enter the object names that the signal tool displays. If any part matches, it is considered a target signal. Default: ArwUP, ArwDN areOne-Click Auto Arrow Trade and the includedSignal Arrow Tool as default arrow names.You can specify multiple strings separated by commas. All conditions must be ANDed. |
| Signal time target | Specify whether the signal target is the latest bar (0) or past bars (1~). If repainting occurs on the latest bar, place the confirmed value of the previous bar (1). |
| Object names for all-close signals Buy close signal object name Sell close signal object name |
Enter the object names that the signal tool displays. If any part matches, it is considered a target signal. Default: ArwCL, ArwCUP, ArwCDN areOne-Click Auto Arrow Trade and the includedSignal Arrow Tool arrow names must match. |
| Settlement signal time target | Input whether the signal target is the latest bar (0) or past bars (1~). If repainting occurs on the latest bar, put the previous bar's confirmed value (1). |
| ▼ Signal tool linkage (index) | |
| Enter the indicator name (file name) of the target signal tool. | |
| Buy signal index Sell signal index |
Enter the index numbers used by the indicator. |
| Signal time target | As above, latest bar (0) or past bars (1~) with repaint considerations. |
| Indicator parameters 1–8 | Enter indicator parameters in the correct order as integers, decimals, or strings. After END, defaults are used. If a numeric parameter goes into a string, prefix with a single quote ('). |
| ▼ Notifications | |
| Notification settings [Common] | |
| true: start minimized. false: start in normal size. | |
| This varies by screen size; if it overflows, reduce each value. | |
| Set the control box position. | |
| Fine-tune the control box font size. Depending on display size and Windows font scaling, MT4 font size may be too large or small; adjust here. 1 is 1:1. | |
| Set the font size displayed on the chart. | |
| Set the thickness of TP/SL and other lines on the chart. Dashed lines when undecided have a fixed thickness of 1. | |
| Set the size and display time for messages shown at the bottom left of the chart. | |
SELL color Trailing stop color |
Specify colors for the buttons, TP, SL, and trailing lines. The position line and limit lines use similar colors by default. If you want the same colors as older versions like V6, change BUY color to Green. |
| Specify colors for the control box | You can freely set the colors for various buttons, labels, and text in the control box. |
■Details of features
Auto calculation by risk %
Order quantity is automatically calculated from the risk % of the funds you hold.
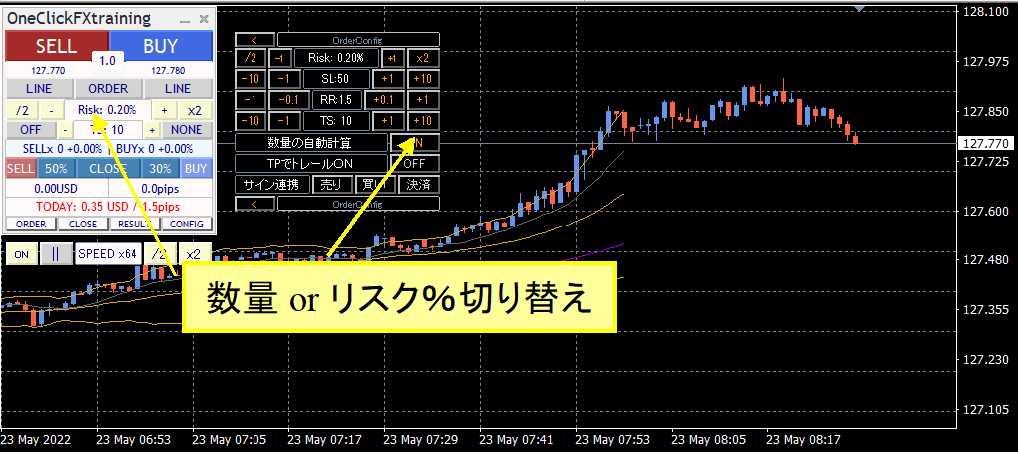
You can toggle between the control box quantity field or the sub-panel “Auto calculation of quantity.”
If you place a market order without TP/SL lines displayed, the order quantity is calculated from the initial SL value and the specified risk %. If TP/SL lines are displayed, quantity is calculated from the order price and the SL line price. Note that turning TP/SL lines on/off returns to initial values and the auto-calculated order quantity may not align with the SL line.
TP/SL lines
Use the control box LINE button to display TP/SL lines.
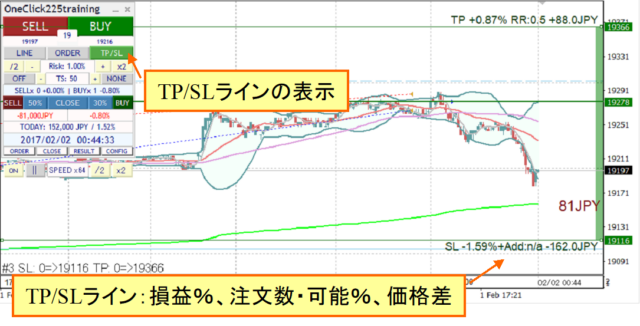
When the LINE button is ON, lines are drawn at the initial TP/SL values. Toggling the LINE button ON/OFF returns to initial values.
Also, if TP/SL lines are OFF, settlements do not occur.
Limit orders
The control box ORDER button shows the limit order line.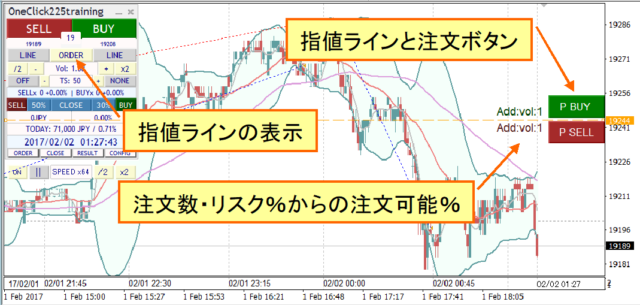
The order button is shown when TP/SL lines are displayed for either SELL or BUY. If BUY’s TP/SL lines are not displayed, the P BUY button is not shown. The number of lots or the possible order percentage from risk is shown beside the button. If it says n/a, you cannot place additional orders.
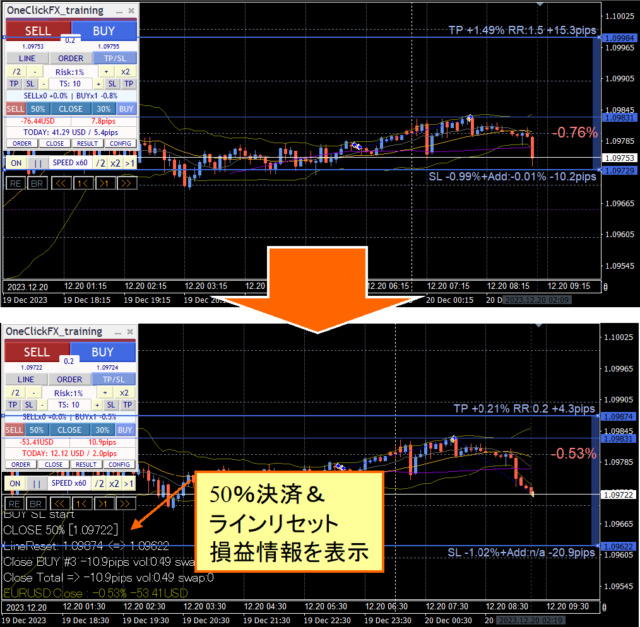
Strategic Close
| CLOSE ALL | All positions closed |
|---|---|
| TrailingStop | Trailing stop ON |
| LineReset | Reset TP/SL lines |
| CLOSE specified%, TrailingStop | Partial close by % with Trailing Stop ON |
| CLOSE specified%, LineReset | Partial close by % with TP/SL line reset |
| CLOSE specified%, LineReset, TrailingStop | Partial close by %, reset TP/SL lines, Trailing Stop ON |
| Additional order, LineReset | Reset TP/SL lines and place additional orders with current parameters. If you are using risk % for orders, further orders may not be placed. This becomes a grid (N) order; please be careful to set a maximum number of positions. |
| Additional order, LineReset, TrailingStop | Reset TP/SL lines, add an order with current parameters, Trailing Stop ON |
When the TP/SL line reset is activated, the TP/SL lines will be reconfigured based on the current price as the reference point.
If the SL line parameter value is 10 pips and a strategic close is activated by the SL line, the current price becomes the reference and the SL line will move by 10 pips.
The TP line will similarly be reset by the SL risk word, but the reset by SL line will only go up to the break-even line.※If you select only line resets without partial settlements, be aware that the SL line may continue to move downward.
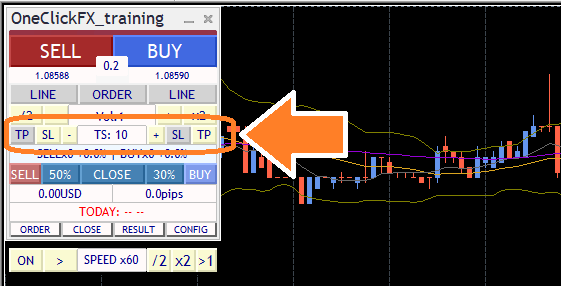
Flexible Trailing Stop - FlexiTrail Stop
The TS blocks in the control panel can toggle the ON/OFF of each trailing stop. From the left, there are sections to set SELL TP, SELL SL, and TS value, followed by BUY SL and BUY TP; you can control four trailing stops separately.
If the buttons do not respond or revert, you may be in a state where trailing stop is set via Strategic Close. It becomes ON when TP or SL is reached, so please wait until then.
The trailing stop line appears in purple when you hold a position. When OFF, it is a dotted line; when ON, it is visible in practice. The maximum value detection differs from previous versions and occurs when ON. Turning ON/OFF recalculates from the current maximum value.
・Fixed: FIX
When ON, close if the price falls below the specified high after the high point. Similar to standard trailing stops.
・Shrink: SHRINK SHORT, MEDIUM, LONG
Basic behavior is same as FIX, but prices update each tick; if no new high occurs within the specified range, the range narrows; when a new high occurs, it returns to the specified value.
Shrink SHORT means about 100 iterations without a new high and near-same price; MEDIUM and LONG require more iterations. When the high updates, values reset to initial.
If the price drops after a high, trailing may lag but allows room for a rebound.
・Average: AVG SHORT, MEDIUM, LONG
When ON, calculate based on the current value and parameter value; as price updates or per tick, compute the current value. Shorter averages track fast; longer averages track slower.
Average (AVG) has no reset and tracks movements more consistently than FIX or SHRINK, so it tends to close positions sooner if price continues to move upward. It tracks large moves quickly and closes securely.
・Moving Average (MA)
Close positions when the price touches the moving average line for the specified period; closes occur at the moment the trend changes. The T/S value is the MA period, displayed as MA20, etc.
・Bollinger Bands (BB)
Close when touching the upper or lower band of the Bollinger Bands for the specified period. For a long, touch the lower band; for a short, touch the upper band. Like MA, T/S is the period, displayed as MA20, etc. Deviation 2 is fixed and cannot be changed.
・Stop & Reverse (SAR)
Close when touching the specified Parabolic SAR with a given step. The SAR is a momentum reversal indicator by J. W. Wilder Jr. The T/S value is in 1/1000 increments. Default 10 means 0.01; 1 means 0.001. Use with the standard Parabolic SAR indicator to compare values.
This video compares the typical fixed trailing stop with Shrink L. Both track new highs, but Shrink narrows the distance to the current price when highs do not update.
Speed Control
The speed control at the bottom of the control box can be increased or decreased by the value you entered in the “Speed control speed list” parameter.
Clicking the “SPEED” part advances one tick, and the rightmost “>1” button advances to the next candle and stops at the first tick after switching.
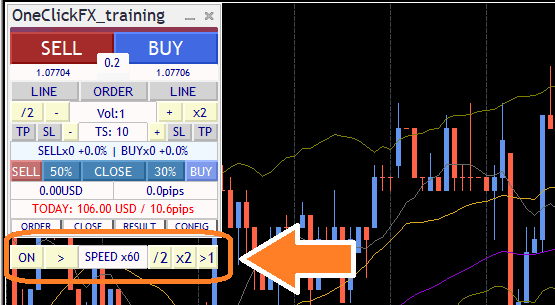
The speed specified in SPEED ranges from 1x (1 sec = 1 sec) to 60x (1 sec = 1 min), 3600x (1 sec = 1 hour), 14400x (1 sec = 1 day), up to a maximum of 604800x (7 days). However, it will not exceed the Strategy Tester's maximum speed. If speed control is OFF, speed is the tester’s maximum (i.e., fastest playback).
Also, depending on PC performance and the complexity of indicators and signal linkage, performance may slow. To use speed control smoothly, move MT4’s speed gauge to the far right (fastest) before using it.
High-speed Skip
A feature to advance the chart quickly with one button. It moves forward quickly until a specified auto-stop time or up to one year ahead. This improves efficiency when practicing trading at a fixed time daily for testing.
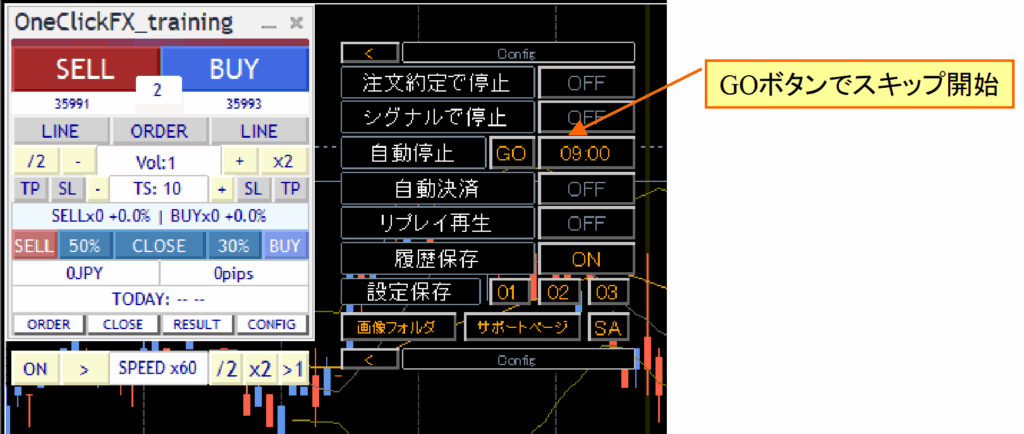
If Auto Stop is ON and the time is shown, skip to that time. If Auto Stop is OFF, skip up to one year ahead.
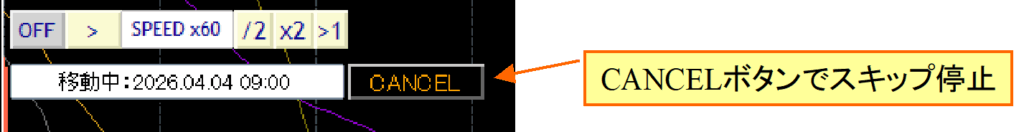
To stop High-speed Skip, press Cancel.
Historical Verifier - TheWorld -
When you pause the chart with Speed Control, additional control buttons appear below Speed Control. These are TheWorld’s control buttons.
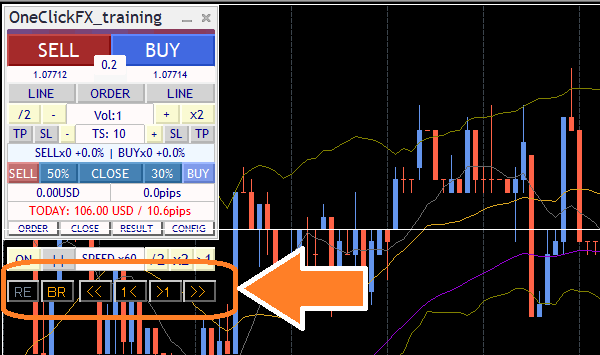
Synchronization lines appear faintly on the chart, and the synchronized chart marks time at the same moment. The chart can be scrolled left and right; when you scroll the main chart with the mouse or keyboard, the synchronized chart aligns its lines as well.
Press “1<” or “>1” to move one candle at a time. “<<” and “>>” move about 10 candles. The number of moved candles varies with zoom level and chart environment.
Note: The simulator is paused, so you cannot move beyond the latest time. You cannot alter past orders or settlements to change history. If you want to modify, use the next TimeLeap restart function.
The “BR” button toggles blind display on/off. When blind is ON, downstream candles beyond the synchronized line are hidden.
The chart with blind ON at top and blind OFF at bottom.
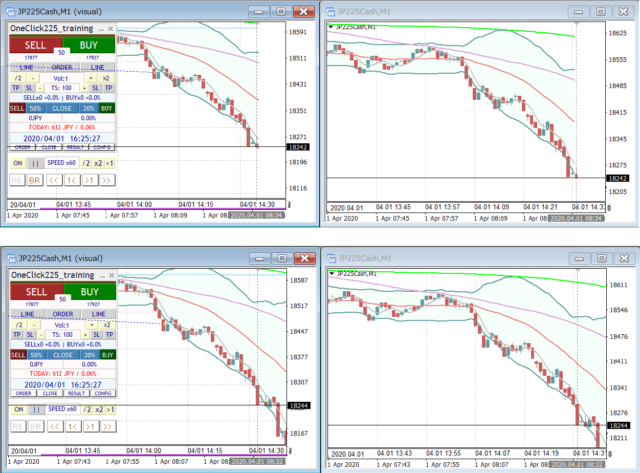
Blind allows you to review past charts and anticipate future moves, highlighting cognitive differences between visible and hidden data.
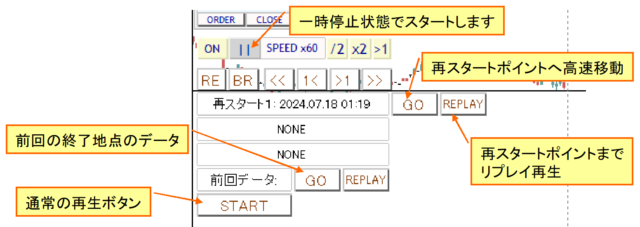
Restart - TimeLeap-
We upgraded the replay function for easier use as a restart feature.
If you pause the chart and press the leftmost “RE” button in the historical verifier, a panel appears. You can save your current state in one of three locations.
If you stop and then press Start, you’ll see a screen to select the restart point.
If you press the saved GO button, you jump to that location with fast-forward. The “REPLAY” button replays the same order in normal playback.
Previous data reproduces the last finished data. Not only the paused moment, but if you scroll back and return to a past moment, the synchronization line moves there and you can save that as a restart point.
This video shows saving the restart point from a stop position up to just before settlements. Restart and redo that portion, then finish and continue from the previous data.
If you press the “Replay” button, it replays with saved order information. During replay, the sub-panel’s replay play is ON, and the speed control’s play/pause button shows an “R”.
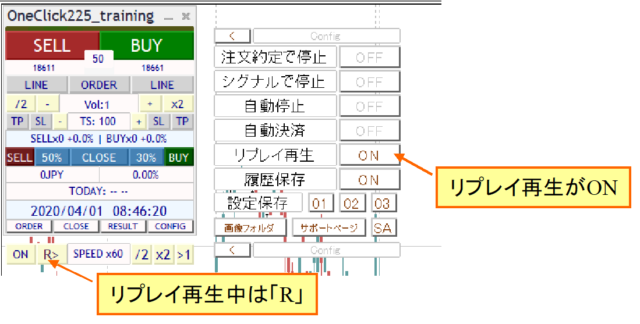
It is fine to turn replay off during replay. Conversely, you may turn it ON at any point. You may also manually settle trades entered during replay. Replay participation continues during replay.
Restart and replay generally require exactly the same settings and same period to trade; thus, they cannot be used with different times or currency pairs.
Additionally, if tick data is regenerated, data integrity may not align, making accurate replay difficult. Note that this replay is not guaranteed to be perfectly exact; it is a REDO, not a true replay.
If you are not in the same environment, it may still work; for example, if you change the spread, order content does not change, but profit/loss will. This can be used for different environment testing.
Auto Image Saving
If you set image saving on for trades to true, charts are automatically saved at order and settlement times. Also, when the date changes, the previous day’s trades are saved as one image. Images saved as shown below.
At tester end (when stop is pressed), the save folder is opened.
The save destination is data folder tester/files/OshiraseSnap.
※Also copy the tester folder included in the product files.
Saved images are overwritten each tester start; if you want to keep separately, copy to another location.
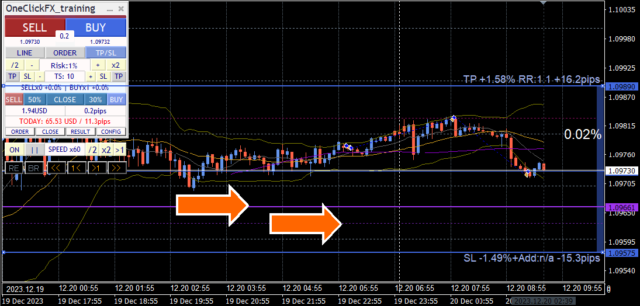
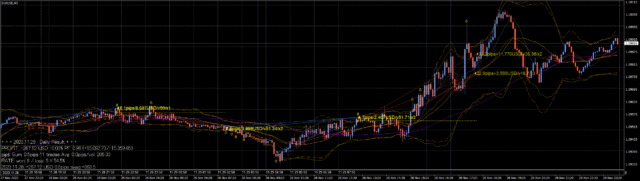
Daily aggregation results display
Open the sub-panel to show yellow lines for past trades and display the resulting PIPS.
Also, clicking the date or TOTAL in the RESULTS sub-panel displays the aggregation results.
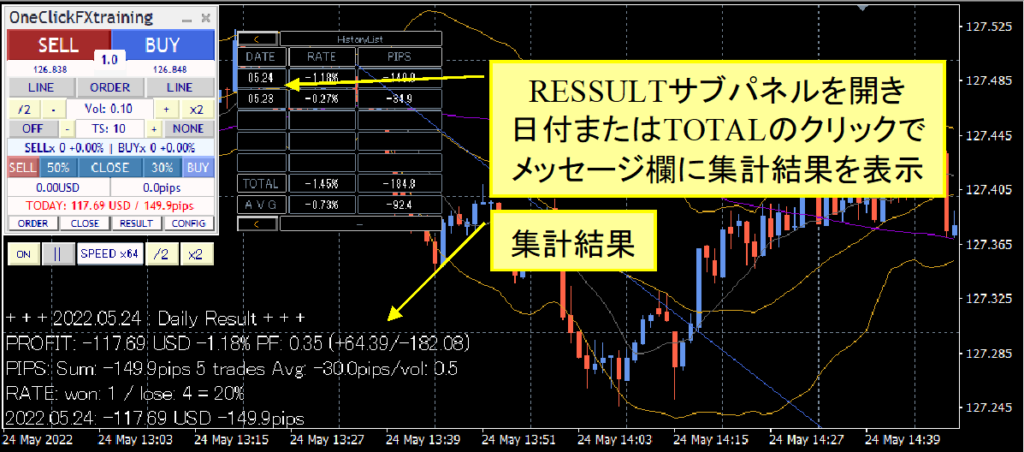
Even mid-day, past conditions are displayed.
Click the header to switch aggregation units to daily, weekly, monthly, or 10 items/100 items. RATE shows PROFIT, PIPS shows PIPS/vol or PIPS/trade as applicable.
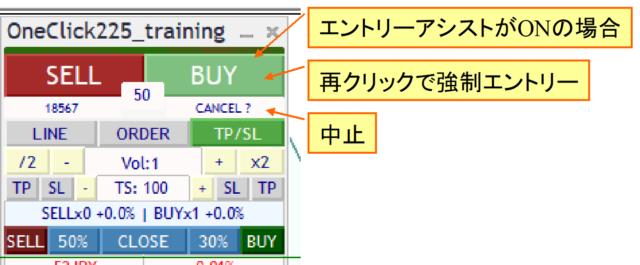
Entry Assist
Entry Assist bases its guidance on the ASK, BID, and mid-prices to detect fluctuations and predict price moves a few seconds ahead.
Using this judgment, after pressing the entry button, it automatically stops actual order placement until optimal timing occurs.
There are three strength levels: weak, medium, strong, and disabled.
Roughly, entries are made as shown below.
Weak: a moment when price movement has halted (reversal from decline)
Medium: reversal has occurred, price upwards
Strong: price is clearly rising
The Entry Assist verdict status can be seen on the color bar at the top of the control panel.
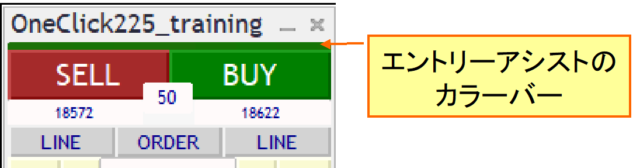
If the color bar is close to BUY color, it indicates a buy signal; if close to SELL color, a sell signal.
In the tester, spreads are fixed, so the color difference on left and right may not appear, but some brokers may show different verdict colors.
With the Entry Assist strength set to weak/medium/strong, pressing the entry button makes it appear lighter and waits for timing. Pressing again forces entry; pressing the lower cancel button stops the entry.
This function forecasts price moves a few seconds ahead, which can help suppress buys during significant drops.
If you set strength to strong, you may avoid entering until a complete rise occurs, which may result in never entering in some conditions. Adjust to market and note that testers and fixed-spread brokers may limit effectiveness.
AI Judgment (AI Export)
You can output trading data for AI use. By loading the output into AI, you can ask the AI to assess or predict trading opportunities.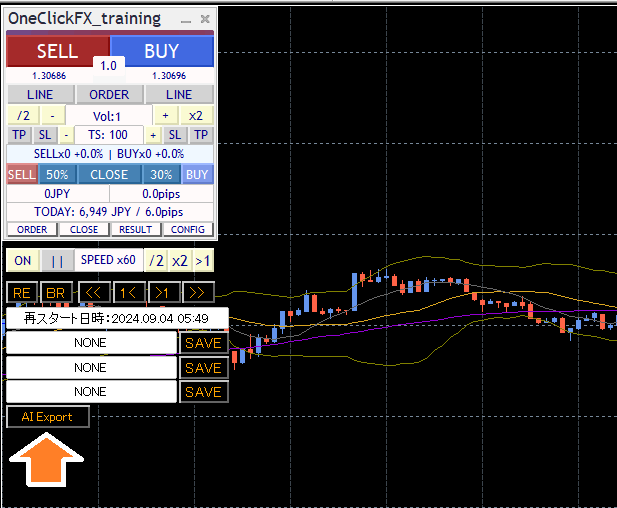
Pause the chart, press the RE button, and click the “AI Export” button at the bottom right of the function panel to open a folder with AI-ready data. Upload this data to various AI generators for use.
https://chatgpt.com/
Please log in to ChatGPT Plus or to the respective AI services.
Upload files from the clip icon.

You will see a confirmation when the upload succeeds.

If AI data loading is successful, try asking various questions.
For example:
“Evaluate and analyze the trading, check if I entered correctly by moving average cross, plot the chart and add a 75 moving average, explain the cause of a large loss and how to avoid it, where would be the best place for a stop and explain logically, rate it?”
AI responses can range from appropriate to completely off-track or unintended. Also, consider whether the content is truly correct. Treat it as one opinion among many.
To elicit better responses, ask specific questions. For example, asking “How to win in FX” will yield vague, generic answers. Explain clearly what you want to achieve. Just as you feed trading data to AI, you should also provide your own information to the AI.
For reference, here is sample data from this interaction.
ai_ssample01、ai_sample02、ai_sample03
※These samples are generated with ChatGPT Plus.
Fortunately, AI will not get angry no matter how many times you ask the same question. If you don’t understand, please ask again. Sometimes it may be impossible, but it will usually provide some answer. Feel free to push the boundaries. If you provide correct information, you’ll get responses aligned with it. If you only receive generic answers, give more specific information and requests.
※ If you are analyzing with a free AI, loading only the history.csv trading history reduces the amount of analysis and allows longer conversations. For deeper analysis, consider the paid version.
Notes: AI-based analysis requires free AI (perplexity.ai, wrtn.jp, ChatGPT) or ChatGPT Plus($20/month). AI Judgment is a tool for evaluating trading results and does not provide investment advice. The data and analysis results are for reference only and do not guarantee any trading results or future performance. Please make your own investment decisions.
Economical Indicators
The included “Economical indicators display subtly【EconomicData_rcm】” shows indicators on the main and synchronized charts. Hovering over colored lines displays the indicators released at that time. By default, indicators related to the currency pair displayed are shown.
Note: If the timing of indicators is off, Simple Synchronization will automatically adjust; however, for the main chart and active synchronization, you may need to manually set the server time difference. The default aligns with the most commonly used summer GMT+3 and winter GMT+2.
Support & Assistant
A convenient feature that automatically collects information when requesting support during trouble.
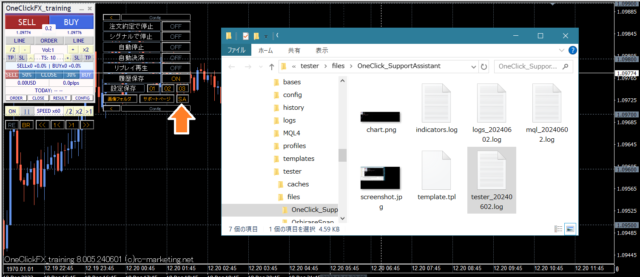
Press the SA button or double-click the OneClickSA Script folder to collect information; a folder will open. Please email the output files.
If you contact us from the form at the bottom of the page, please attach the automatic acknowledgment email after submitting the form.
■Synchronization settings for Sub-Charts
There are two types of synchronization sub-charts.
1) Use normal online charts for simple synchronization that is light and easily switchable
2) Use Active Offline Charts for near real-time display (Active Synchronization)
Simple synchronization uses standard online charts, so if past data is prepared, you can specify a preset chart to begin synchronization and easily create synchronized charts. You can change the timeframes and currency pairs in the same way as online charts.
However, for shift-based indicators, the chart head may be hidden, and there may be bugs in the sub-window due to multiple indicators. There are workarounds but with limitations.
Active synchronization creates dedicated offline charts and updates on the fly to resemble online charts, but some indicators may not be supported offline. Frequent updates may slow operation.
Each has pros and cons; use the chart most convenient for you.
Simple Synchronization
1) Open a chart for any currency pair
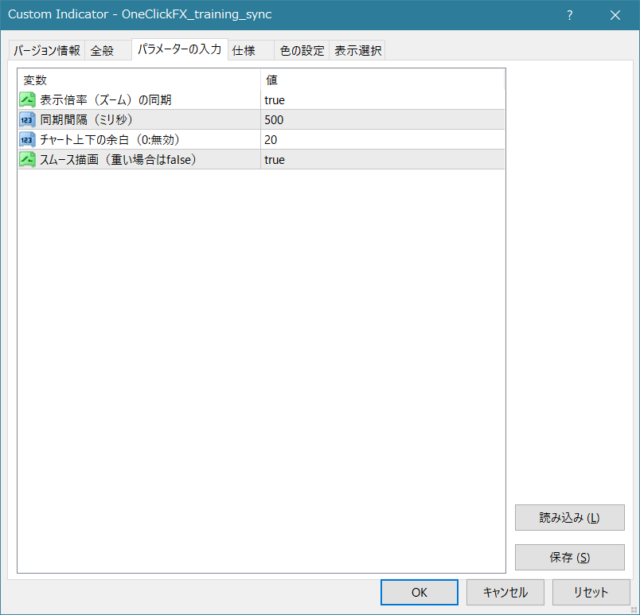
2) Right-click => Preset Chart => OneClick225_training_sync
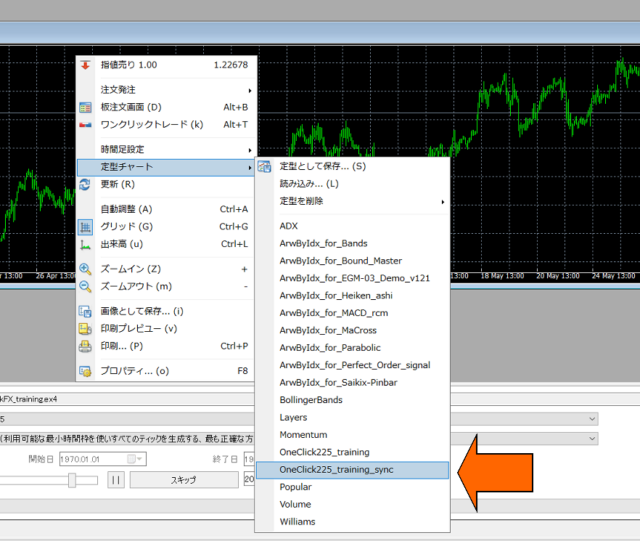
3) If needed, change parameters and press OK
The chart margins at top and bottom are percentages. 0 means default margins.
4) The charts will synchronize
Note: If speed is too high, synchronization may lag

Active Synchronization
1) Open the chart for the pair to synchronize
2) Display the timeframe to be synchronized
3) Right-click => Preset Chart => “OneClick225_training_sync”. It shows “Active offline sync ready.”
To perform active synchronization with other timeframes, change the timeframe and confirm “Active offline sync ready” for each.
Note: This step is required only for the first time; not needed subsequently.
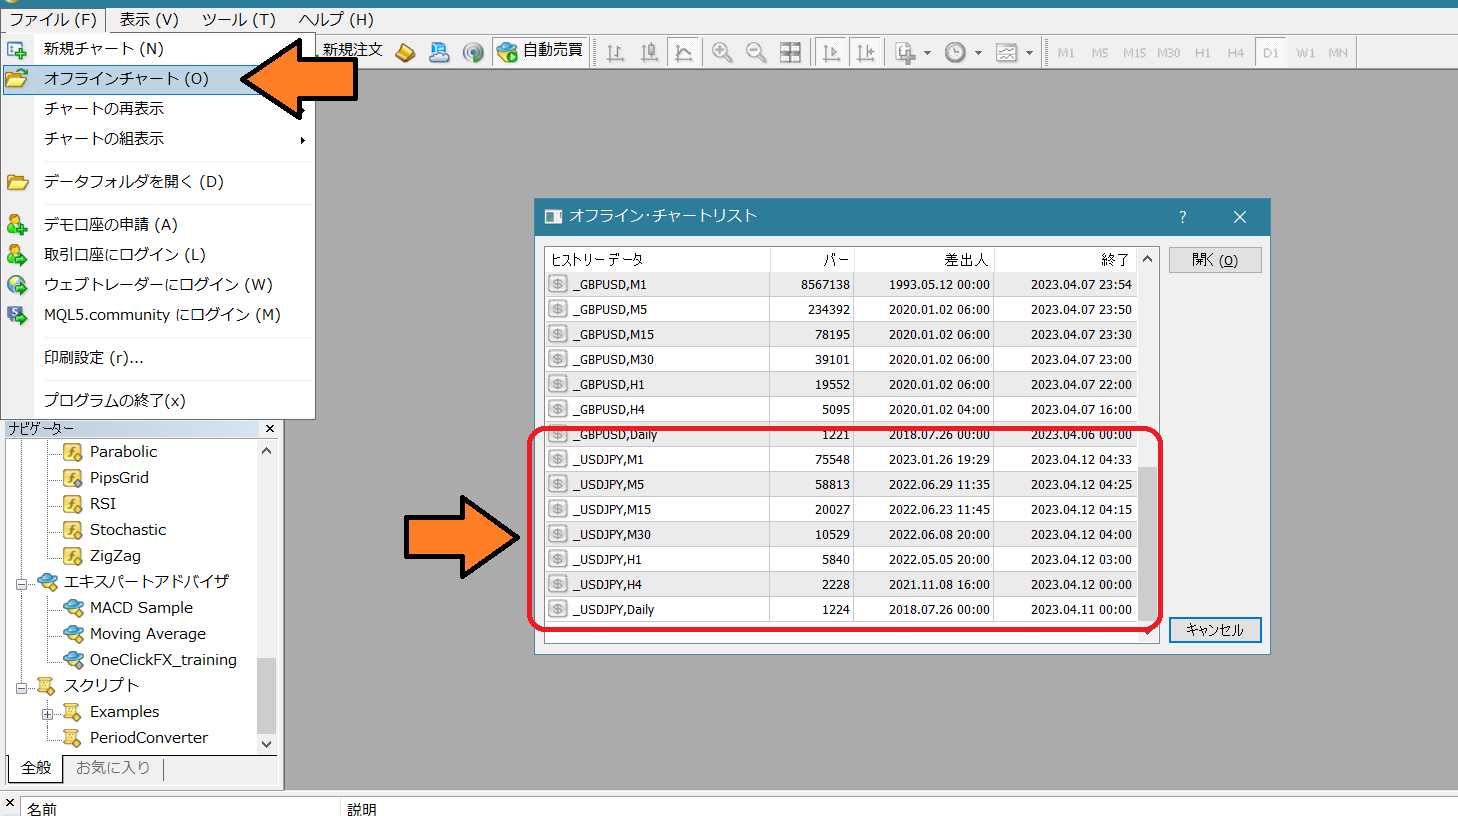
4) In the File menu => Offline Chart, open the offline chart whose name begins with “_” (underscore) (e.g., _USDJPY 1 minute to daily)
5) Right-click => Preset Chart => OneClick225_training_sync
3) As with Simple Synchronization, adjust parameters as needed and press OK. Charts will synchronize.
Create offline charts for synchronization all at once
Note: The latest version does not include a bundled option for this.Please create offline charts individually.
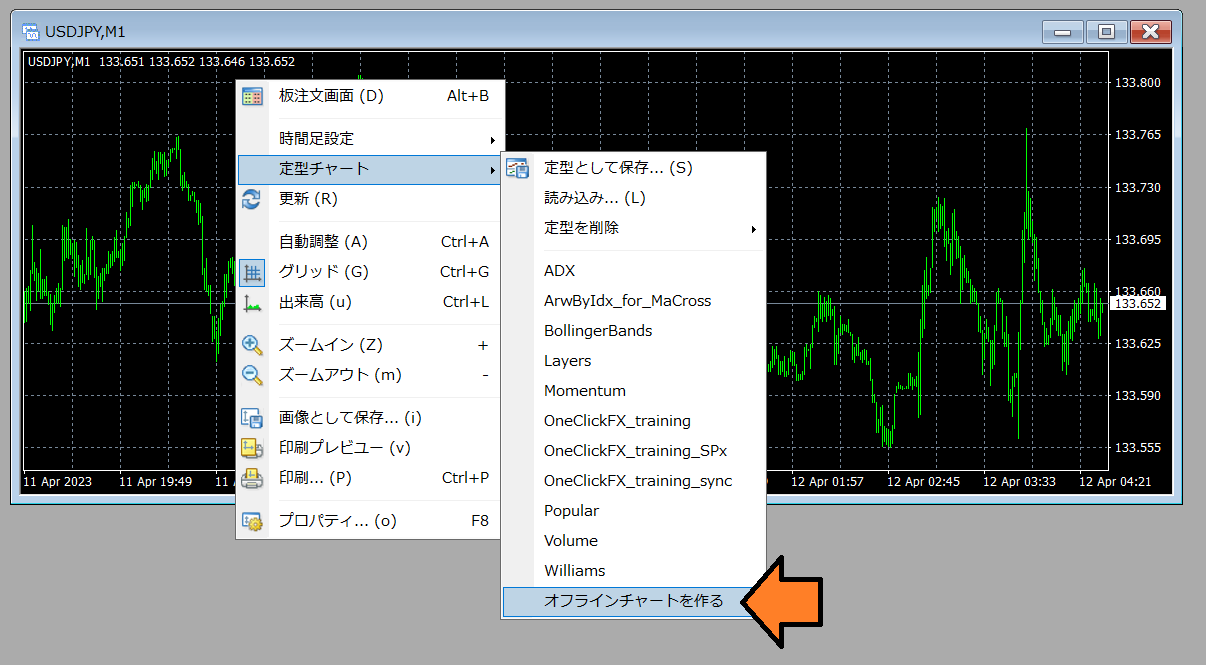
1) Open any chart, right-click => Preset Chart => “Create Offline Chart”
3) It will automatically begin loading past data; wait until complete, then close the chart.
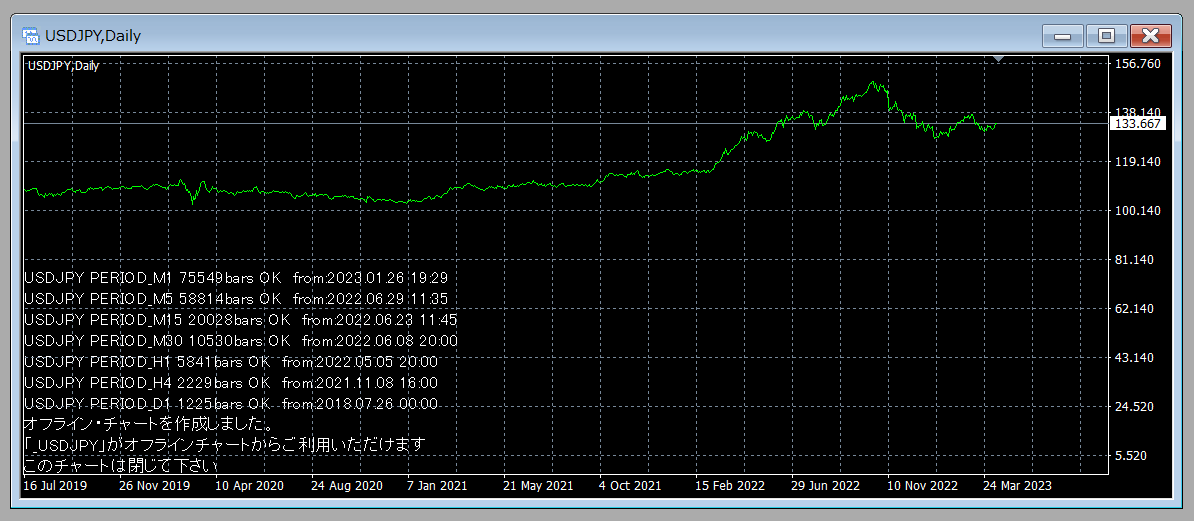
Proceed to step 4 of the Active Synchronization above.
■Linkage with Signal Tools
One-Click Auto Arrow Trade [AutoArwTrade]easy linkage and the includedSignal Arrow Tool(free version) allow you to enter entries based on arrows from other signal tools and enter on chart changes like golden cross.
Linkage with One-Click Auto Arrow Trade
1. Place a compatible signal tool on the chart.
2. Turn ON the buy/sell linkage buttons.
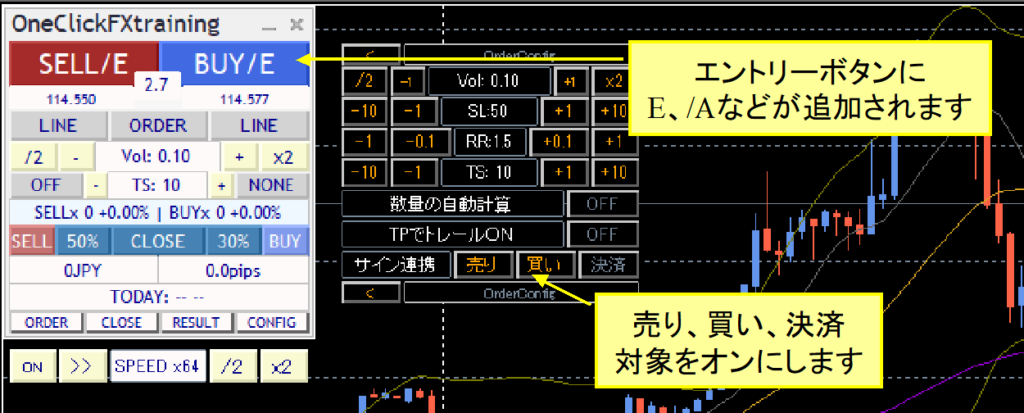
Signal linkage has two modes; when signals are paused by parameter signals or CONFIG signals to stop ON, you pause used by speed control for analysis without entering. If OFF, you enter trades. If Pause ON when a signal is generated, you can analyze trading decisions on signal generation.
If you turn off the leftmost button of Speed Control, speed becomes fastest (max bar). If arrows do not appear, advance to where they would appear.
Linkage with Signal Arrow Tool
Linkage with signal tools can be achieved with the previously described parameters and the includedSignal Arrow Tool(free version)
The Signal Arrow Tool (ArwByIdx_rcm) can enter trades based on arrows from other signal tools and enter on chart changes like golden crosses.
There are sample presets included for you to try, and there are sample preset charts included for further testing as well.
ArwByIdx_for_MaCross.tpl… Moving average cross
After starting the tester, right-click => Preset Chart and select the above preset charts.
In the orders sub-panel, enable signal linkage (sell, buy, close) so that the buttons show /E (or /A).
Linkage under complex conditions
If you’d like the following sample preset charts, contact us.
OneClick225_training_SPx… complex conditions using multiple signals
This preset chart uses three signals: moving average cross, MACD cross, Bollinger Band breakout to enter on chart changes.
Please adjust the parameter settings for signal linkage in OneClick225_training_SPx.set as shown below.
Sell signal object names: MACDxDotArwUP, MAxDotArwUP, BandsArwUP,
Buy signal object names: MACDxDotArwDN, MAxDotArwDN, BandsArwDN,
Load the preset at the bottom-right of the settings screen by pressing the “Load” button to apply OneClick225_training_SPx.set.
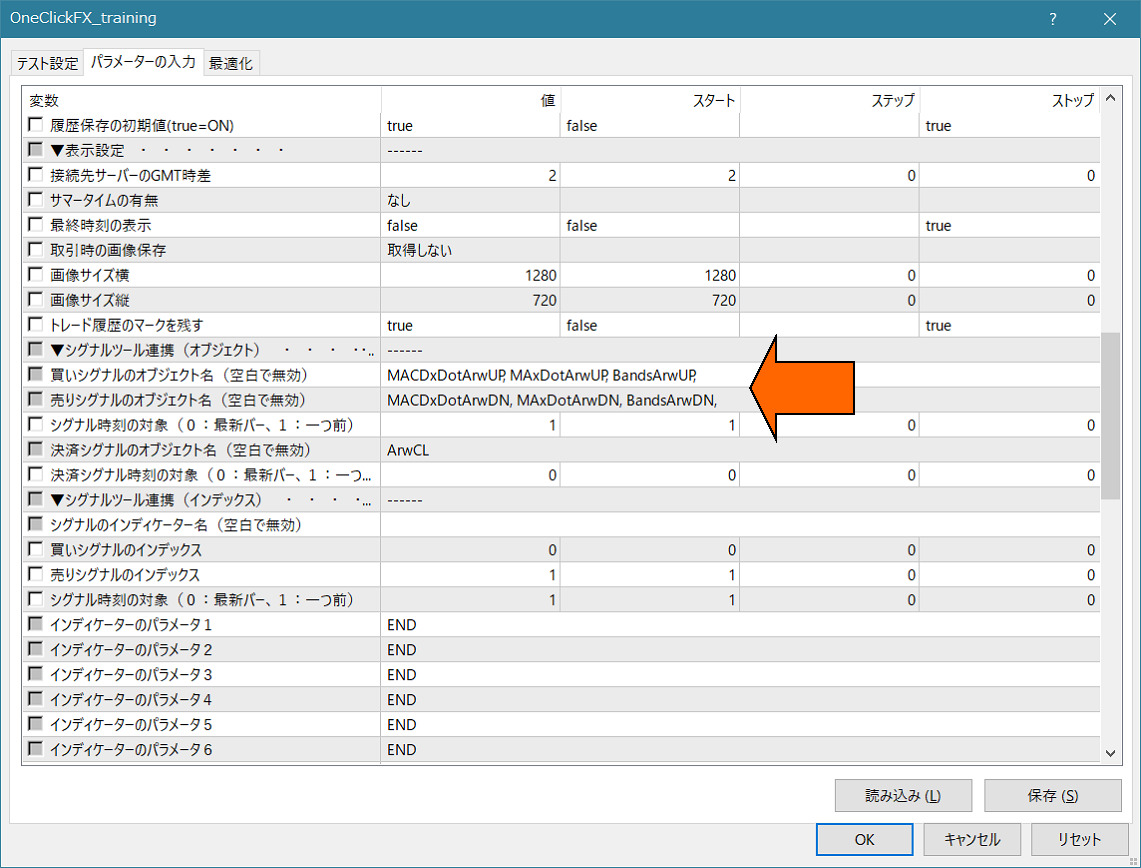
Set and operate as with simple linkage.
Arrows or dots will appear at the upper limits, and when all three conditions match, signal linkage activates.
Enter the parameter for the arrow named “ArwByIdx,” and register it into the preset chart; you can freely change the preset chart while the tester is running.
Feel free to use various combinations.
If you’re unsure how to set it up, please consult us. Your signal tools can be linked with almost no errors.
If you tell us the signal tool name and parameter information, we can provide the required settings.
■Indicators included
Display JST (Japanese Standard Time) in MT4/MT5 (JPN_Time_rcm)■Troubles & Tips
・Prepare past data
【2024 Edition】How to prepare MT4 past data without failure
・No past data
If you don’t have past data, refer to the above page. If you purchased this product, contact us for guidance.
・Want to use older colors like V6
Change the parameter “Buy color” to Green.
・Profit/loss with commissions
For accounts with commissions, P/L shows including commissions, but PIPS are shown without commissions.
Note that commissions can occur in various patterns, so not all cases can be guaranteed.
・License authentication error
Possible causes include using a different purchase email, invalid email entry, Windows not up to date, or security tools blocking. Please contact support if unsure.
Troubleshooting
Cautions
The market is diverse; we cannot guarantee integration with all signal tools. Especially, products with password protection or tools with countermeasures may not be supported. We can sometimes custom-develop integration for a fee. Contact us for inquiry. This product is a practice tool, and results may not reflect actual trading outcomes. Price data displayed by brokers and by this tool may not match. To prevent misuse, online authentication uses encrypted SSL communication.
■If you’re stuck
If not functioning normally, acting oddly, or stopping suddenly, first check this area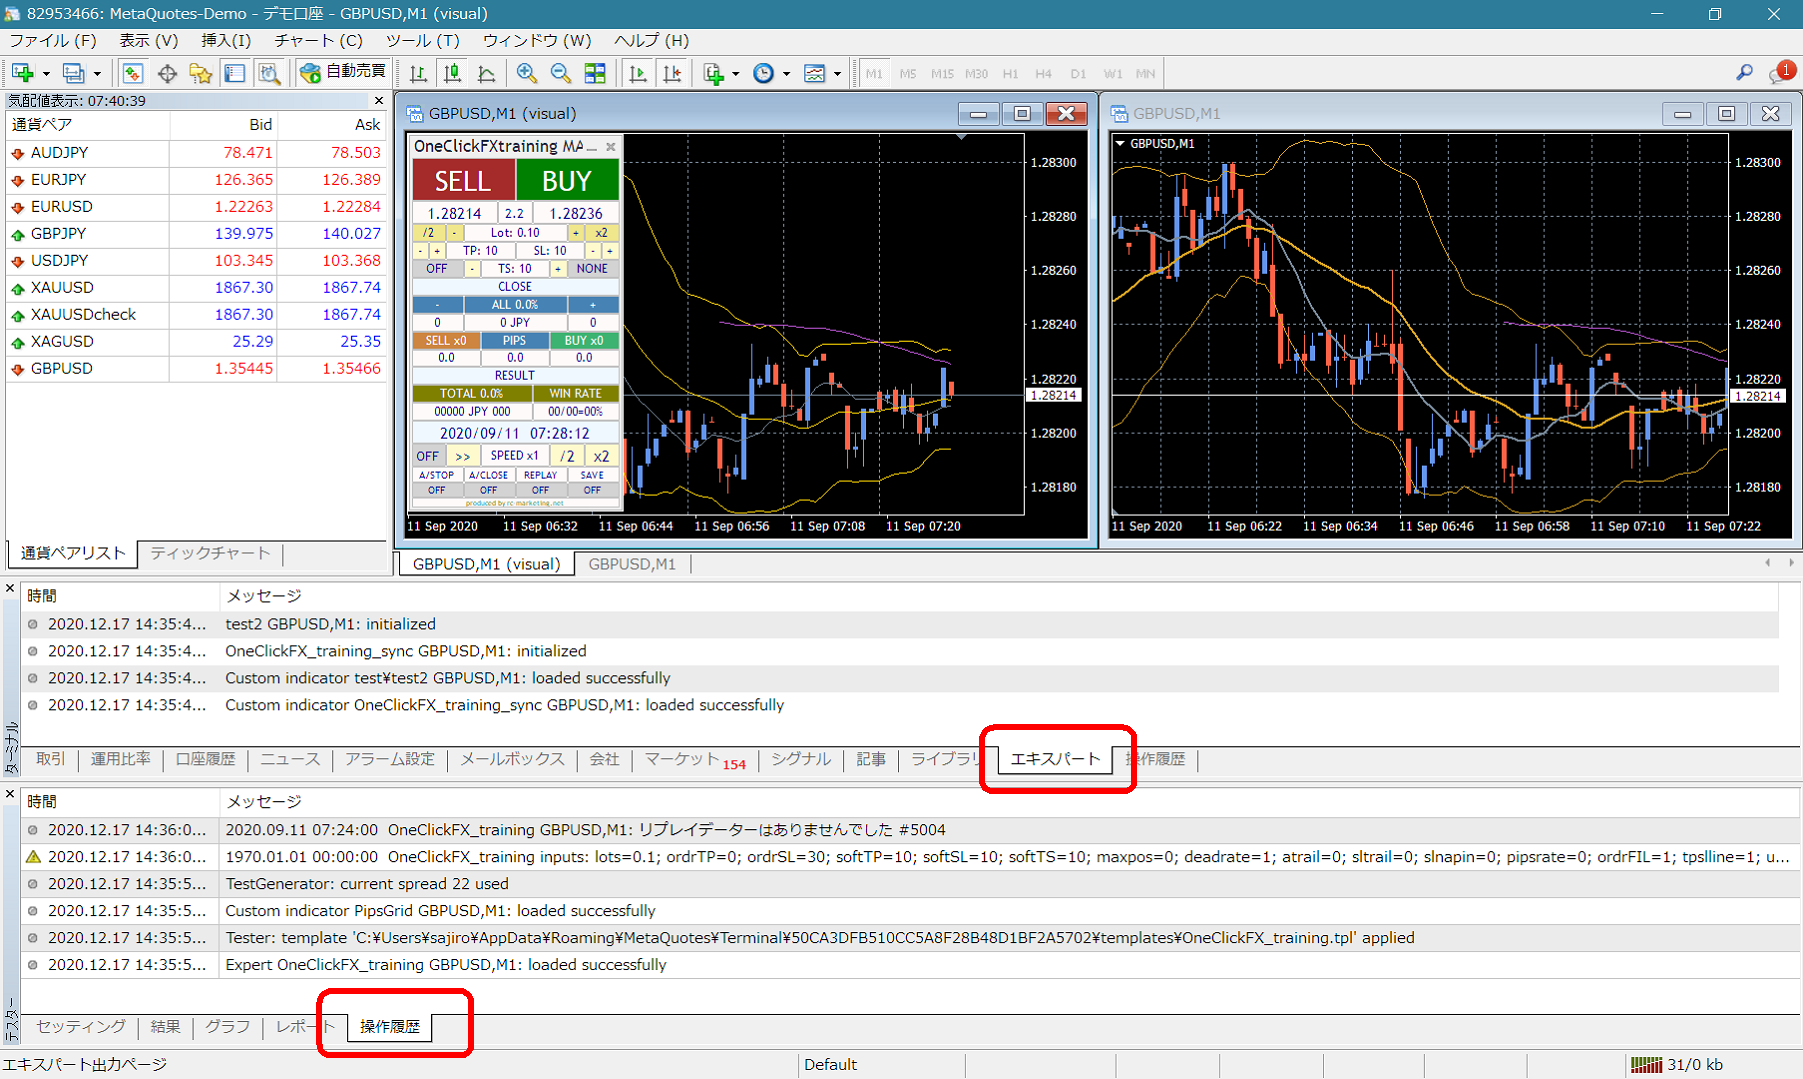 If there are error messages in the Terminal Expert or Tester history, please let us know those messages to expedite the response. Your cooperation is appreciated.
Support & Assistant
Some products include a convenient one-click button to collect information for trouble support. Press the “SA” button to collect information and open a folder. You can also double-click the Script folder’s OneClickSA to open the folder in the same way.
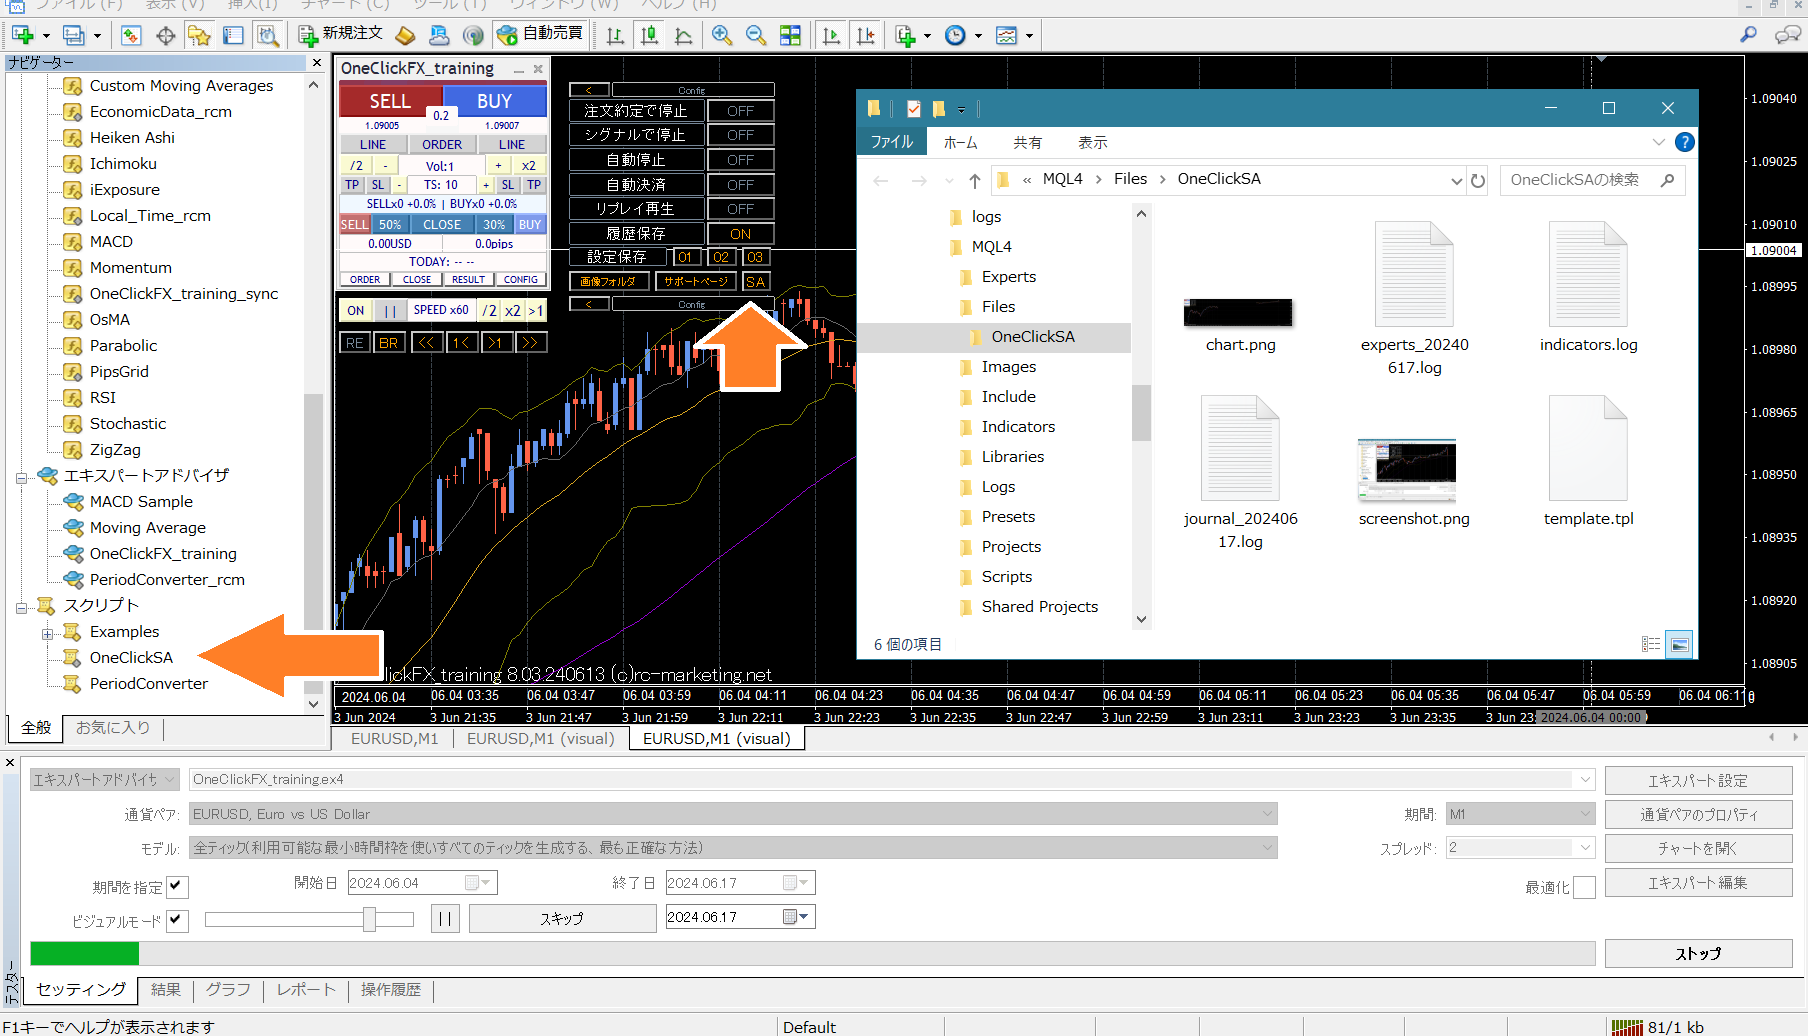 Please attach the output files when sending.