Current analysis of the USD/JPY: “Range in the bottom zone: time adjustment” March 7, 2018 19:00
March 7, 2018, 19:00, USD/JPY, 4-hour chart
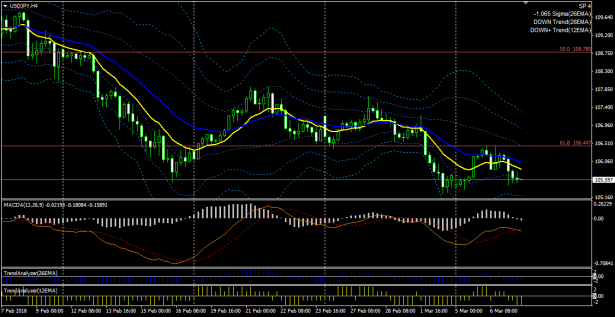
Half of this week has passed, but the price has not broken below last week's low, and it is forming a range in the bottom price area.
This morning's news showed a downward move, but it did not reach a new low.
As noted in Sunday's analysis, this is thought to be because the downward momentum is weakening.
The lows are not making lower lows, but highs are not making higher highs either, so the current trend is downtrend.
The MACD being negative (12 EMA below 26 EMA) also indicates a downtrend.
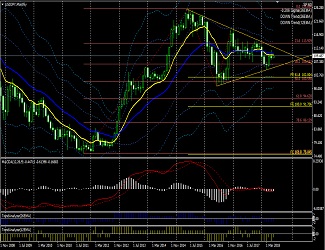
Looking at the longer-term view, the movement is interspersed with a 61.8% Fibonacci retracement.
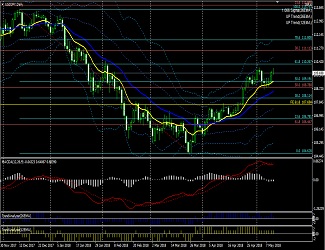
March 7, 2018, 19:00, USD/JPY, Daily chart
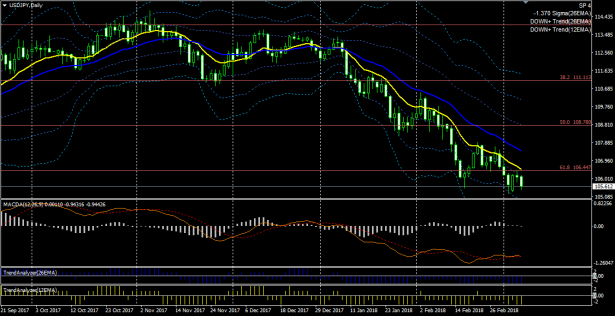
The price is moving below two EMAs, and the downtrend continues, but after MACD bottomed around mid-last week, there is a gradual upward tendency, indicating that the downward momentum is decreasing.
In terms of price action, there is no clear retracement high; it appears to be a time-adjusted situation.
↓ MACD used in the above chart.
Display MACD, signal, and OsMA, and set up to 4 alerts.
MACD (four types of alerts, email possible)
↓ The template and indicators for the above chart. Technical indicators can also be purchased individually.
MACD (four types of alerts, email possible) trading system

Stochastics (alerts, email possible) | MT4 indicator that can send alerts/emails for cloud breakouts, etc. |
This article is an excerpt from the blog “When you watch and freely adjust, the market becomes a magic wand.”