Current Analysis of USD/JPY: "The downward trend continues, but momentum is waning" March 4, 2018
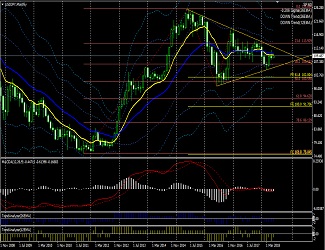
March 4, 2018 USD/JPY Monthly

The current USD/JPY market is in a corrective phase after the uptrend that began in 2012. It is also a correction phase of the late-2016 uptrend.
Applying Fibonacci retracement to the highs and lows of 2016 shows that the current price has retraced 61.8%, with momentum aiming for a 78.6% retracement. The Bollinger Bands are narrowing, so that area could be viewed as the probable endpoint of the correction.
However, from wave theory, an ABC corrective wave is forming with the 2015 high as the starting point, and the current move could be the extension of Wave C. In this case, the end point of Wave C could fall below the 2016 low. Another possible wave pattern is a pennant formed by an ABCDE 5-wave from the 2015 high. In that case, the current wave would reverse around the 78.6% retracement.
MACD and Bollinger Bands show no clear directional bias.
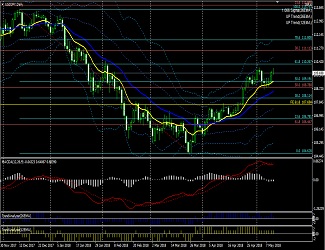
March 4, 2015 USD/JPY Weekly

On the weekly chart, Bollinger Bands are widening, indicating that the recent decline has gained momentum. MACD and OsMA are also declining, corroborating this trend.
Although the latest candlestick has set a new low, its close did not fall below the previous candle’s low, so a strong decline cannot be declared. However, Bollinger Bands and MACD can be read as signaling the start of a strong drop.
Looking at past markets, when the yen weakens, price moves tend to form clean, rising candles, but when the yen strengthens, the market tends to move with declines followed by recoveries, making the judgment difficult.
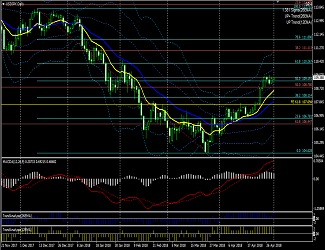
March 4, 2015 USD/JPY Daily

As seen by the relationship between the two moving averages and the price, the downtrend continues; however, as noted on the weekly chart, although a new low was made, the close is above the previous low, suggesting the downward momentum is weakening.
MACD is also shallower than the previous bottom, indicating a decrease in downward momentum. It is highly likely that a divergence will form at the next bottom. However, even if that happens, it does not guarantee that the decline will end at that point. Since MACD itself is deep in negative territory, there is a possibility of another new low and a second MACD divergence.
↓ The MACD used in the above chart.
Display MACD, Signal, and OsMA, and set 4 types of alerts.
MACD (4 alert types with email possible)
↓ The template and indicators for the above chart. Can also be purchased as individual technical indicators.
MACD (4 alert types with email possible) Trading System

Stochastic (alerts and email possible) | MT4 indicator that can send alerts and emails for cloud breakouts etc. |
This article is an excerpt from the blog “Look and freely set the charts and the market becomes a magical tool.”