

Astat 225❷ Strategy Verification in Three Stages
The overall flow of strategy verification consists of three steps. Based on the obtained analysis and verification results, iterate feedback and brush up the strategy.
- Setting Strategy Rules
Decide the strategy and set purchase/sell rules in the Excel workbook. - Create Data for Analysis
Create the data for technical indicators used by the rules. - Strategy Analysis and Verification
Apply the configured rules to the created data for analysis and verification.
Now, I will explain the details of each item.
Procedure for Setting Strategy Rules
First, create the strategy rules. The following file is used for the settings.
- ASTAT.xlsx
Determining Buy/Sell Rules
The buy/sell rules to set can be obtained from AutoTrade Strategy Shop, etc., or created independently (original).
- Obtained from Strategy Shop, etc.
If obtaining (purchasing, etc.) from AutoTrade Strategy Shop, please choose one whose logic is公開 (public). Furthermore, if obtaining from sources other than Strategy Shop, confirm whether the technical indicators such as moving averages and MACD and the time frame support AutoTrade 225. Without this, rule setting and automated trading cannot be performed.
- Create an original
The method to create an original is explained separately.
Setting the Strategy Book
Once the strategy is decided, set the rules in the Excel book.
- Create the Strategy Book
Please copy Excel Book ASTAT.xlsx and then use it. Rename the copied file to the strategy name. The strategy name can be anything, so choose a name that is easy for you to understand. This Excel file with the rules set is referred to as the 【Strategy Book】.
- Strategy Book sheet structure and sample entries
The Strategy Book consists of four sheets, each corresponding to AutoTrade 225 "Order Reservation Settings - Transaction Type" for new buy, new sell, cover buy, and cover sell. Note that the ticker name is fixed to "Nikkei 225 Futures (Mini)" and the quantity to "1 contract," so there are no settings for these items.
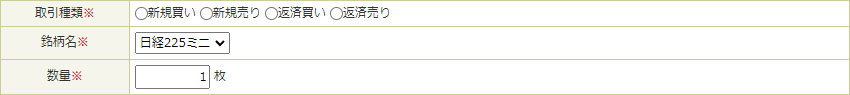
Below are examples of entering data into each sheet.
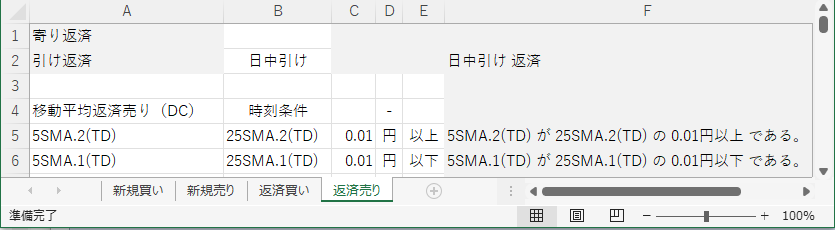
- Enter rules into the Strategy Book
Enter rules into the white cells of the sheets. Leave sections that you do not set blank.
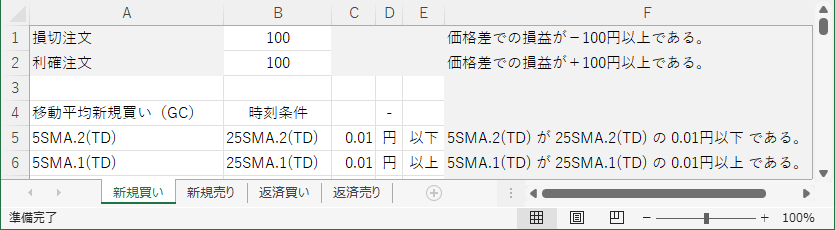
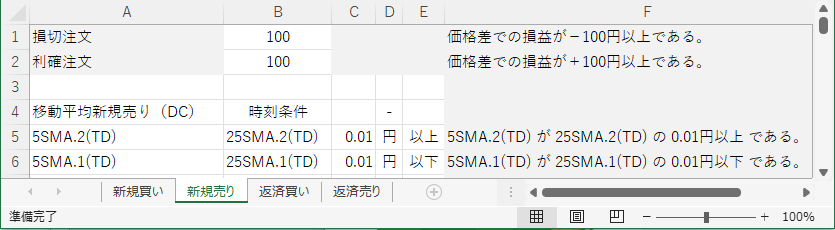
Lines 1–2 are designed to easily set commonly used items.
• For new entries, you can set stop loss and take profit orders. Enter prices as numbers.
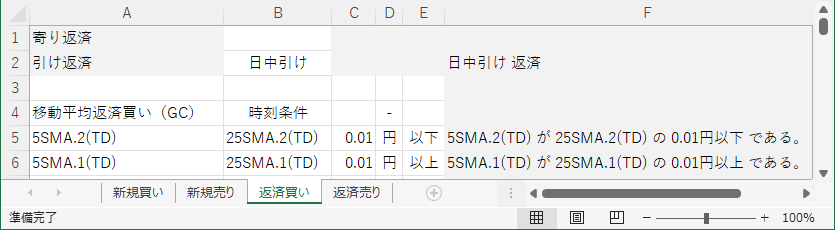
• For covers, you can set at opening and closing covers. Enter like day session open, night session close. If you simply use open and close, it will cover both day and night.
From the third line onward, set the ordinary orders other than the above.
The first line (in the example, line 4) is the “Order Reservation Name” and the “Time Condition.” In AutoTrade’s settings screen, this is the part you see. The time condition appears when you click “View detailed settings.”

From the next line onward (example shows line 5), enter the conditions. Each line corresponds to “Condition 1,” “Condition 2,” etc. This part is also shown in AutoTrade’s settings screen. Note that in the current ASTAT version, the order condition is fixed to “No Condition,” and the order price is fixed to “Market Order.”
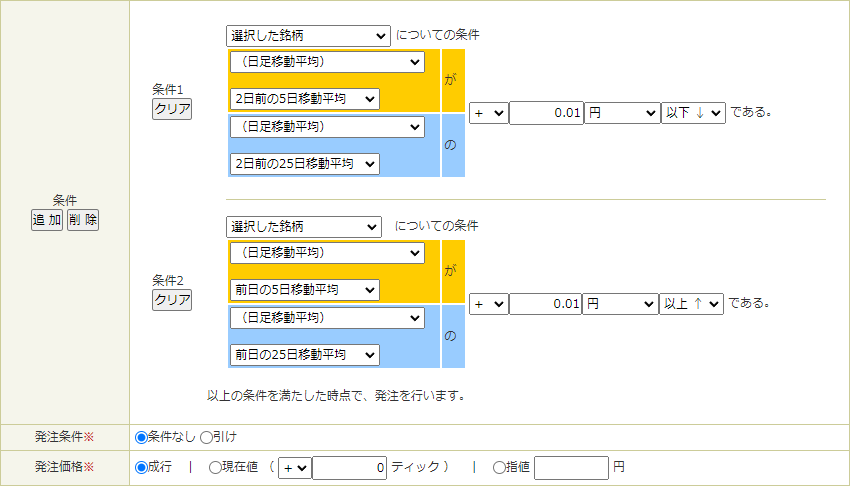
Replace the yellow (~) and blue (~) portions in the figure above with abbreviations used in the ASTAT Strategy Book (see next section). If there are multiple order reservations, simply add lines below. This completes the Strategy Book.
Guidelines for Entering Conditions
- Price of the day
Enter in the same way as AutoTrade.
Currently, real-time price, high/low from the previous day’s close, and upper/lower limits are not supported. - Time-related
Not supported. - Price after placement
Enter in the same way as AutoTrade. - Post-placement P/L
Stop loss and take profit are prepared separately, so please use those. - Technical indicators, etc.
The four-price data and technical indicators have many variations in number of candles and time frames, so abbreviations are used for input. Details of the abbreviations are explained next.
Abbreviations for Condition Input
The abbreviations for condition input combine the name of the indicator, and the number and type of candles three elements.
Example: 2 days ago 5-day moving average → 5SMA.2(TD)
The abbreviations for indicator names are as follows. Please convert all except Kanji and σ (sigma) to half-width characters.
| Indicator Name | Abbreviation | Indicator Name | Abbreviation |
|---|---|---|---|
| Four price data > Open | Open | RSI over 9 days | 9RSI |
| Four price data > High | High | RSI over 14 days | 14RSI |
| Four price data > Low | Low | RSI over 42 days | 42RSI |
| Four price data > Close | Close | Bollinger Bands +2σ | 2σ+ |
| 5-day moving average | 5SMA | Bollinger Bands −2σ | 2σ- |
| 25-day moving average | 25SMA | Stochastic %k | %k |
| 75-day moving average | 75SMA | Stochastic %d | %d |
| 100-day moving average | 100SMA | Stochastic > Slow%d | Slow%d |
| 150-day moving average | 150SMA | DMI > +DI | DI+ |
| 200-day moving average | 200SMA | DMI > -DI | DI- |
| MACD | MACD | DMI > ADX | ADX |
| MACD > Signal | Sgnl |
The abbreviations for the number and type of candles are as follows.
| Number of Candles | Abbreviation | Type of Candles | Abbreviation |
|---|---|---|---|
| Daily > Previous Day | .1 | Trading Day Frame | (TD) |
| Daily > 2 Days Ago | .2 | Business Day Frame | (BD) |
| Daily > 3 Days Ago | .3 | 5-min | (05) |
| Daily > 4 Days Ago | .4 | 10-min | (10) |
| Tick > Most Recent | .1 | 15-min | (15) |
| Tick > 1 Bar Ago | .2 | 20-min | (20) |
| Tick > 2 Bars Ago | .3 | 30-min | (30) |
| Tick > 3 Bars Ago | .4 | 60-min | (60) |
Procedure for Creating Analysis Data
After the Strategy Book is completed, create the data for analysis. Up to four files are used for data creation as follows.
- 1DataDownload(225labo.ini)
- 2ConvertTime
- 3AddIndex
- 4MergeFiles
Downloading Four-Price Data
The four-price data can be downloaded from225Labo. Accounts can be created for free, so please register. After registration, set the username on the first line of “225labo.ini” and the password on the second line. This completes the preparation.
Run1DataDownload to automatically download Nikkei 225 four-price data for the desired year. Note that the daily four-price data include all past years up to this year.
Convert Time to Actual Dates
After downloading the data, convert the time from trading days to actual dates. The trading day is set so that the night session open at 16:30 of the previous day begins, because the day session close (15:15) is desired to be the end of that day.
Run2ConvertTime to automatically convert trading days to actual dates by selecting the desired candles. After this conversion, the data can be exported in a format compatible with MT4, which is common in FX, so please also use it for chart analysis explained separately.
Generation of Four-Price Data and Technical Indicators
After converting time, generate four-price data and technical indicators and add them. The technical indicators are all those used in AutoTrade 225.
Run3AddIndex to create the desired candles and select the ones used for the strategy to be tested; it will automatically generate the indicators and append the data to the files. If using multiple time frames, create them one by one.
Merging Data Files with Multiple Time Frames
If the strategy uses multiple time frame types, create each file separately and then merge them.
Run4MergeFiles to select the two desired files and merge them automatically. If three or more files are needed, merge them two at a time in order.
Strategy Analysis and Verification Procedure
When the Strategy Book and analysis data are complete, the final step is strategy testing. For analysis and verification tests, use the following files along with the files prepared up to this point.
- 5ASTAT
Analysis and Verification Tests for the Strategy
Based on the rules set in the Strategy Book, use the analysis data to perform analysis and verification.
Run5ASTAT to automatically analyze and verify by selecting the data file, the Strategy Book, and the buy/sell category. If only a single file is used, the selection screen may be omitted.
【Navigation Menu】
General Overview
Three Phases of Strategy Verification
How to Use the Tool
Examples of Basic Logic
Appendix I: MT4 Utilization Manual
Appendix II: Four-Price Data Download and Time Conversion Method