USD/JPY Current Analysis: “A temporary consolidation phase continues within the decline” February 28, 2018 18:00
Since exactly half of this week has passed, I will check the current state of the USD/JPY market.
February 28, 2018, after 18:00, USD/JPY, 4-hour chart
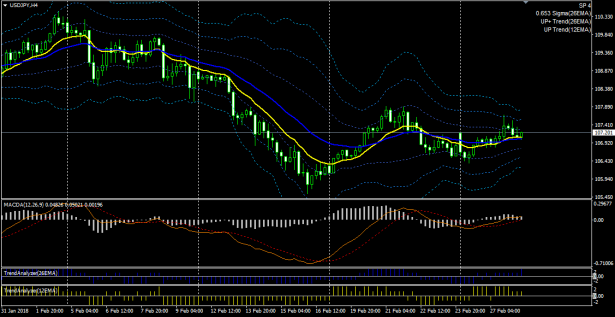
I was wondering if any movement would begin as a result of Mr. Powell's remarks last night, but no change occurred, and the sideways flow continues. On the 4-hour chart, the MACD is hovering around zero, and the Bollinger Bands are narrowing, indicating that the market movement is reflected technically as is.
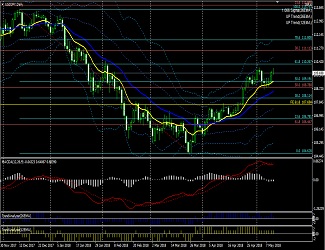
February 28, 2018, after 18:00, USD/JPY, daily chart
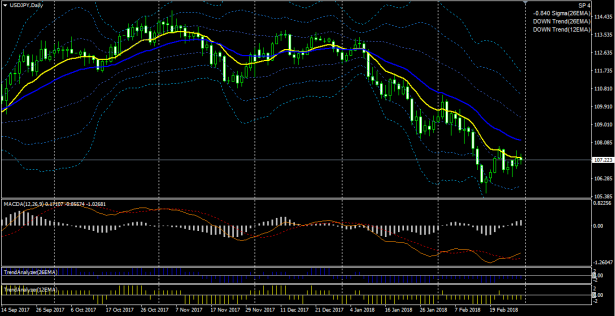
On the daily chart, the 12 EMA acts as resistance, and the downtrend continues.
The current price is near the 12 EMA, which can be considered a retracement high.
The MACD has a gold cross, so the daily trend is weakening.
The Bollinger Bands are also starting to narrow, indicating that the trend is weakening.
↓ MACD used in the above chart.
Display MACD, signal, and OsMA, with four types of alerts available.
MACD (four alert types, email capable)
↓ This is the template and indicator set for the above chart. Technical indicators can also be purchased individually.
MACD (four alert types, email capable) trading system
This article is an excerpt from the blog “When you can look and freely place, the market becomes a magic wand”.