
Crude oil has signaled an additional upward move, but the situation remains tight (Point & Figure (Secret Chart), MACD, and Stochastics))
0.1 USD frame P&F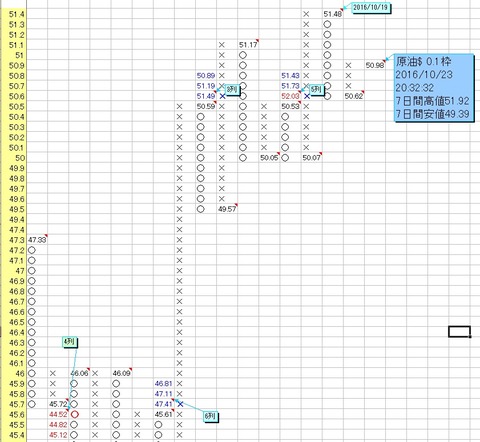
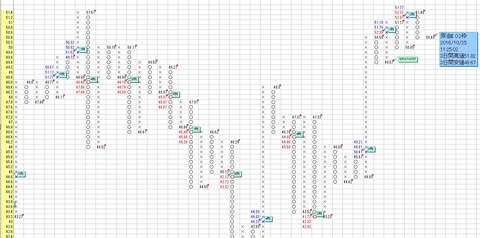
0.2 USD frame P&F
MACD
Blue line = MACD, pink line = MACD signal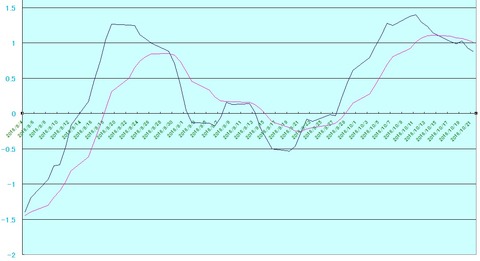
Slow Stochastic
Blue line = %K, pink line = %D, yellow line = Slow %D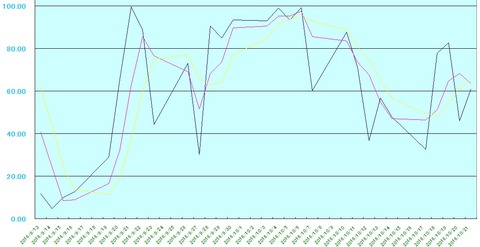
As described above, additional upside signals have lit up on crude oil with 0.1 and 0.2 dollar frame points & figure.
The 0.1 dollar frame target of 52.03 dollars is almost reached.
The 0.2 dollar frame target is 52.97 dollars.
There seems to be a possibility of one more push.
However, from other technical analyses, the situation appears to be becoming harsher.
Low-false signals relatively indicate a downward signal with MACD on 8/17/9, and a downward has also occurred ().
Also, a downward signal has occurred in Slow Stochastic, and a downward is emerging as well ().
There is a possibility of one more push, but it seems to have entered the caution zone.
Points & Figures (Secret Chart) screen introduction
If you want to know more about Points & Figures (Secret Chart)
I uploaded a YouTube video showing how to create USDJPY Points & Figures (Secret Chart)
× ![]()