Current analysis of the USD/JPY: “A temporary adjustment phase within a decline” February 25, 2018
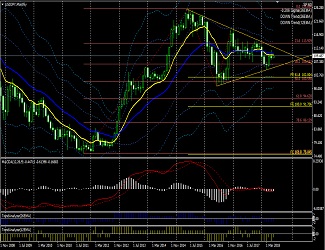
February 25, 2018: USD/JPY Weekly

Since the beginning of this year, it has been in a downtrend, and it seems that the downtrend is intensifying now.
The 12 EMA is below the 26 EMA.
Candlesticks are moving below the EMA.
The 26 EMA Bollinger Band is starting to widen.
MACD has been in a death cross since last year.
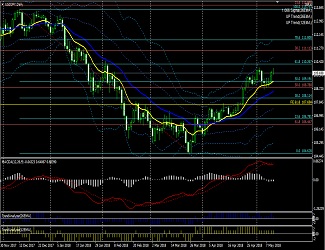
February 25, 2018: USD/JPY Daily

From the high last November, it seems to be a downward directional movement. Currently, the third wave extension may still be in progress.
Looking at the MACD line, it has formed a bottom, but considering the wave pattern, it is highly likely that it will retest the lows once more. If a MACD divergence appears at that time, the daily downtrend might temporarily come to an end.
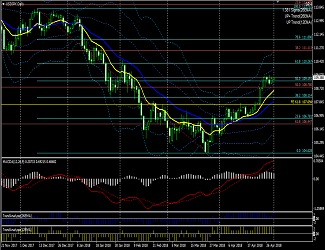
February 25, 2018: USD/JPY 4-hour

In the 4-hour chart, it feels like a range is forming. It may be a time adjustment in preparation for the next downward move on the daily chart.
Just a hunch, but after a pennant-like move, it seems ready for the next action.
↓ The template for the above chart. You can also purchase the technical indicators individually.
MACD (four types of alerts and email capable) trading system
This article is an excerpt from the blog “When you watch and freely apply, the market becomes a good luck charm”