

ワンクリックFXトレーニングMAXのサポートページ
This page is a support page for purchasers.
※ Publicly available for everyone, including those considering a purchase. Please review the product features and usage details. If you have any questions, please feel free to contact us.
If you are considering purchasing the product, you can purchase from here.
https://www.gogojungle.co.jp/tools/indicators/22485The latest version is 8.33.251210.
Upgrading for purchasers is free ⇒Download Center
※ By downloading or launching this product, you agree to the Terms of Use.
▼ 2025-12-06 v8.33
Added ST button (overwrites default fixed chart),
First-order limit orders use TP/SL lines as reference
Entry time filter
Trailing stop completely separates TP/SL two values
Trailing stop: Protect / Break-even
Restore object parameters on restart
Parameter changes for Trailing Stop (AVG, SHRINK)
Break-even line thickness linked to TP/SL lines
Parameterization for 4K large screens
▼ 2025-06-12 v8.26
Chandelier Exit added,
Fee display
▼ 2025-04-15 v8.22
Fast skip
LINE specification changes
▼ 2025-01-07 v8.20
AI Judgment
Independent scrolling of synchronized charts
Keyboard operation included
Object synchronization tool distributed
▼ 2024-11-14 v8.18
Reset + TS added,
Trading history added daily/weekly/monthly, 10/100, PROFIT, PIPS/vol, PIPS/trade,
Font change for messages
Save date changed to chart date-time
▼ 2024-09-09 v8.16
Error page display, stronger chart synchronization hiding, added minimize-start, adjusted synchronization bar, BE line swap, deletion of stop-orders on settlement, added start button on launch, downloader improvements, one-click SA warning handling, bug fixes, parameter and color adjustments, etc., included in the package
▼ 2024-06-06 v8.01
Added line thickness parameter,
Added automatic order splitting
Fixed mismatch message for margin and currency pair
Added Support Assistant,
Added color bars for entry timing
Added spread to SL calculation
Added time-leap feature,
Added restart functionality,
Added historic verification viewer
Added strategic close,
Added flexible trailing stop
Separated TP/TS and SL/TS handling for TP/SL
Message double-click clears
Keyboard settlement added,
Packaging of perks like indicators
▼ 2023-11-12 v7.60
Next-bar-forward button added
▼ 2023-10-20 v7.51
Added color to close messages,
Clicking date in history displays results
Other bug fixes ▼ 2023-09-29 v7.50
One-click Auto Arrow Trading [AutoArwTrade]Support
Add buy/sell settlements to signal integration
Display profit/loss and size in history
Speed up signals integration
Add credit to profit calculation
Add only first-order to server orders
Change minimum RR to 0.1
Add execution time to TP/SL line display at order time
Add parameter for initial position of control box
Automatic generation of active synchronized charts
▼ 2023-04-22 v7.30
ASP comments revised
▼ 2023-04-12 v7.281
Activate synchronized charts
Save button to fixed charts
Fix jittering of position bars
Display and comments edits
▼ 2023-03-11 v7.11
License authentication with WebRequest,
ASP compliance,
Auto-nan pin button
Font size scaling
Add speed list
Support for multiple signals,
Slack notifications 2022-09-16 v7.010 bug fixes, etc
▼ 2022-09-04 v7
Add limit entry orders
Add automatic risk calculation
Margin profit % (risk %) added
Daily profit % display, trade history display
Position information display
Risk-reward added
Position triangle display change
Daily summary image auto-save
Sync chart right-edge shift support
Add corrected risk% calculation
▼ 2022-04-16
Upon full settlement, add TP/SL/TS reset flag
Fix NONE triangle and other bugs
▼ 2021-10-15 v6
Immediate position display on entry
Tool control TP/SL invalid values
Reject entry on negative balance
LINE, Discard notification added
Change triangle color to mid between BUY/SELL
Add initial value parameters
Error, fill messages display area added
Reduce load during speed control
Support for some fee-bearing accounts
▼ 2021-06-02
Add forced liquidation line
Prevention of repeatedly opening the settings screen
TP/SL drag & drop for orders supported
Add a sub-panel
Add individual settlement, partial settlement
Support for active fixed charts changes
Add compact mode
Signal integration (index) parameters added
Signal integration (object) close added
Free version of signal integration indicators included
Turn ON/OFF signal integration
License authentication added
▼ 2020-08-08 additions
Signal tool integration
Automatic saving of trade images
Change control box to preferred colors
Break-even line
TP, SL lines
Charset changed to PIPS
Parameter整理
PIPS-based line drawing PipsGrid bundle
Position display in synchronized charts
SL standard & trailing
Automatic averaging for SL
Fund amount percentage line
▼ May 25 additions
ASK line normalization for easy P/L
Auto-trailing ON/OFF
▼ May 1 additions
TP/SL disabled at order time
Enable trailing at take profit for maximize profit
Add PIPS display for profit
Red for negative numbers
Add currency name to all, RESULT in profit
▼ March 27
Display current spread (including live version)
Display order target and stop target as triangles
Add order target and stop target in real version too
Trailing stop includes MA, BB, SAR
Add time difference and daylight saving settings to time display
Add synchronization scaling for other charts
Add dedicated templates
※ This page also contains pre-upgrade images
■Product contents
One-Click FX Training MAX is a high-function FX trading simulator that lets you practice and test discretionary trading even on weekends when the market is closed. It is available 24/7, 365 days a year, so you can practice anytime you notice.
Beyond basic features like speed control, automatic setting of take profit/stop loss orders, and limit orders, it includes replay, signal tool integration, partial settlements, automatic risk calculation, history saving, automatic image saving of trades, daily aggregates, time-leap, restart, rich display capabilities, and more, making it a thorough practice and testing tool.
From daily practice to tool testing and technical analysis, it can serve various purposes.
- Product contents
- Initial setup
- Launch One-Click FX Training
- Operations & parameter settings
- Details of features
- Sub-chart synchronization settings
- Integration with Signal Tools
- Indis included with the package
- Troubleshooting & Tips
- When in trouble
■Initial setup
Please refer to the setup page to permit DLL, configure authentication, and install One-Click FX Training.
Basic setup for One-Click FX seriesAfter setup is complete, please restart MT4.
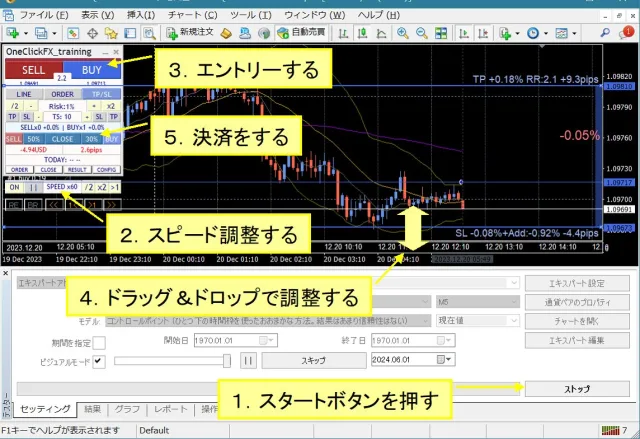
■Launching One-Click FX Training
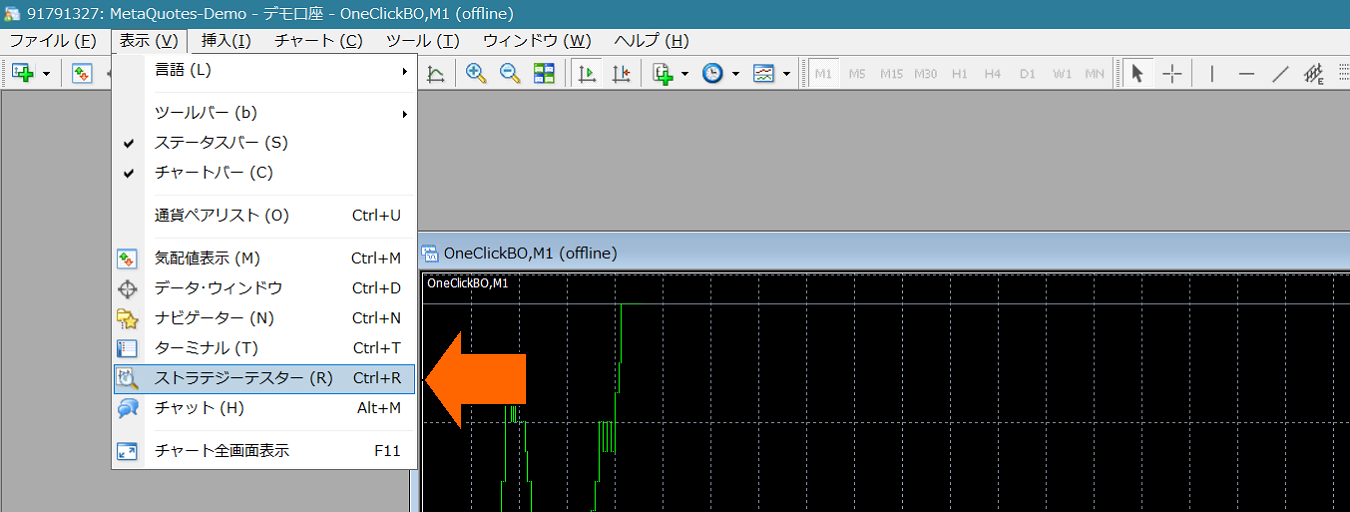
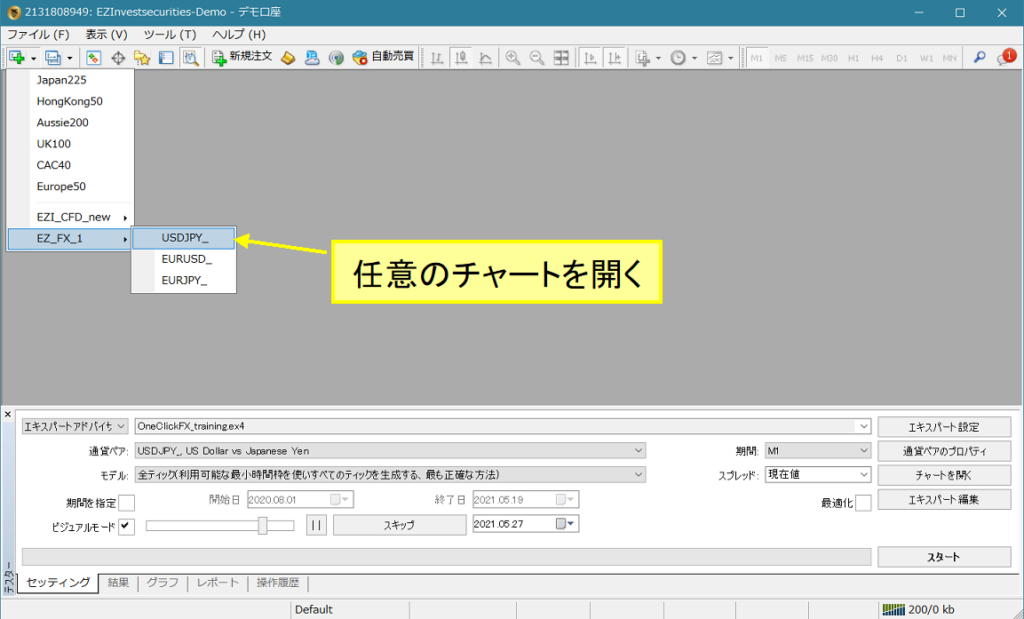
4) Open the Strategy Tester window.
5) In Strategy Tester, select Expert "OneClickFX_training", any currency pair,Model as "Control Points" (scalping etc. practice uses all ticks)Check Visual Mode, uncheck Optimization. Increase speed slider to 31 or 32.
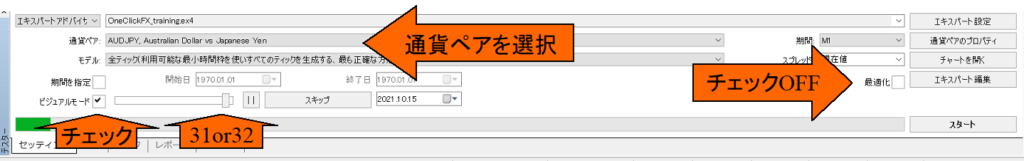
※ If Visual Mode or other displays are not shown, here =>If MT4 tester does not show Visual Mode, speed slider, period, etc.
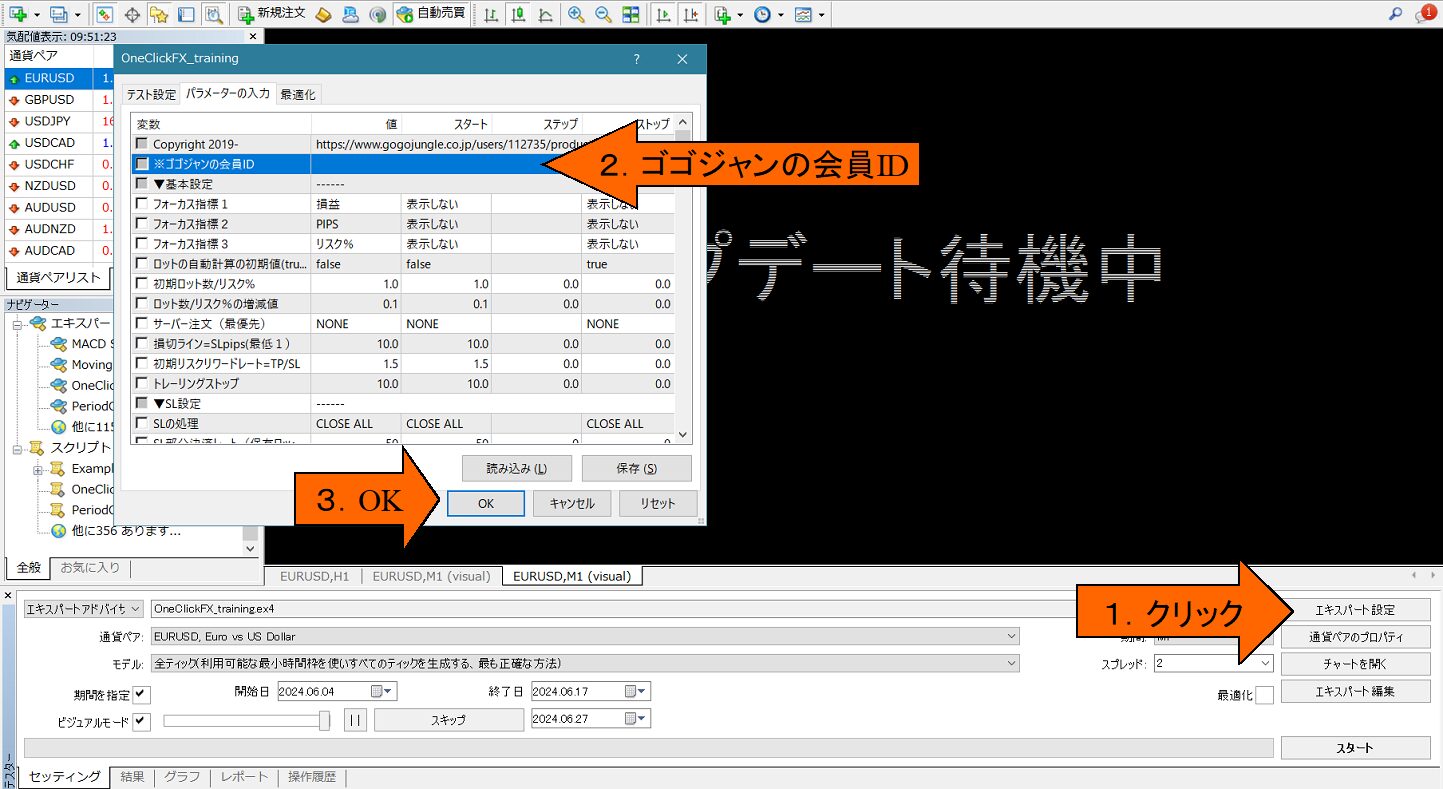
6) 【Important】From Expert settings,Open the parameter input screen and enter "GoGoJang Member ID" then OKto proceed (other parameter information will be detailed later). If authenticated with a different address, it may be considered misuse.If you authenticate using One-Click FX Downloader, you do not need to enter your email address.
7) Press the Start button at the bottom-right of the tester window (the image shows Stop button)
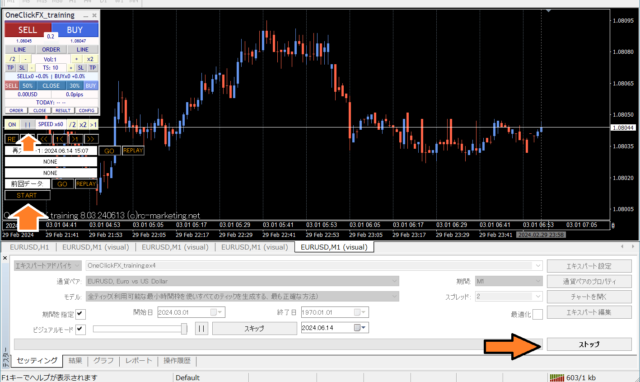
After displaying "Updating waiting", the chart screen will appear. If license error appears, review your email address. Press Stop to halt. From the One-Click FX Training MAX control panel in the chart's top left, press the pause button at the arrow, then start again.
This will operate with default values. Press buy/sell and settlement buttons to verify operation.
If it stops right after starting, please check the error items in the operation history tab.
If you want simple trading practice first
Change fixed chart during tester operation
There are three fixed charts included.
・OneClickFX_training:A fixed chart automatically applied at startup. Includes original chart colors, Bollinger Bands, moving averages, PipsGrid, economic indicators, and Japan time display.
・OneClickFX_training_core: Simple version with original chart colors and Bollinger Bands only.
In addition to the above, you can freely change charts via right-click => Fixed Chart, using your own charts as well.
Set margin to Japanese Yen
From the Expert button, open test settings, and in the right dropdown for initial margin, directly type "JPY". Leave as is, but add at least two zeros to prevent capital loss.
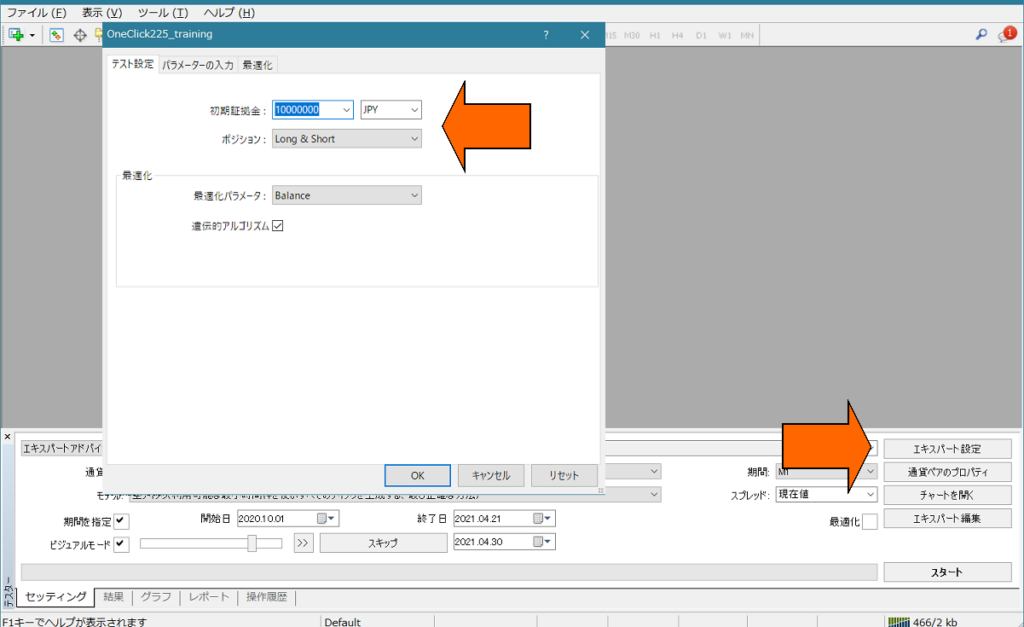
Depending on the broker, orders may be stopped immediately if the currency pair is not in Japanese Yen. In that case, adjust the margin to the pair you are using.
For details =>Make margin currency in MT4 Strategy Tester Japanese Yen
■Operations & parameter settings
How to use One-Click FX Training MAX
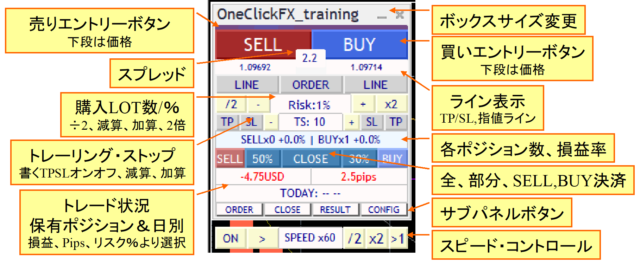
Main panel (normal mode)
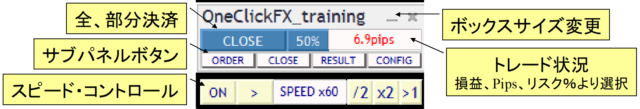
Focus mode
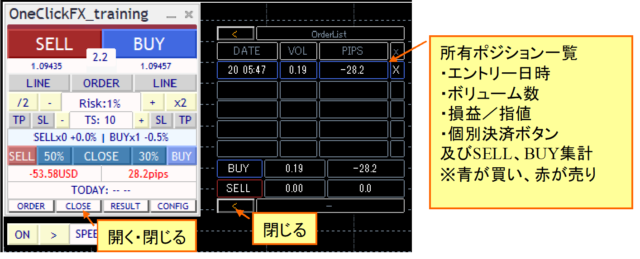
Orders sub-panel
Close sub-panel
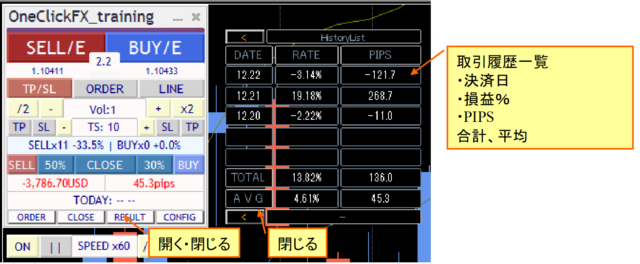
History sub-panel
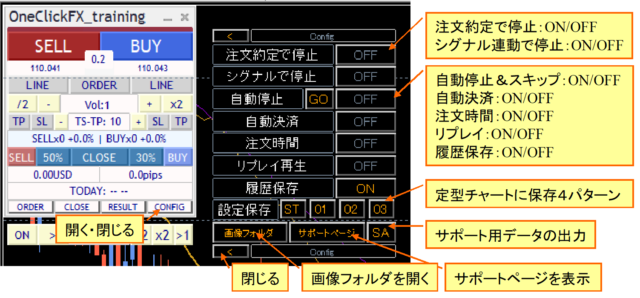
Other sub-panels
Speed control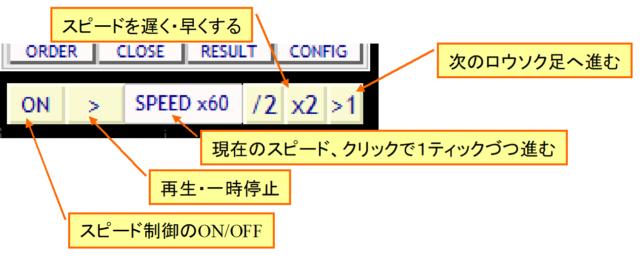
Pause before/after movement and restart save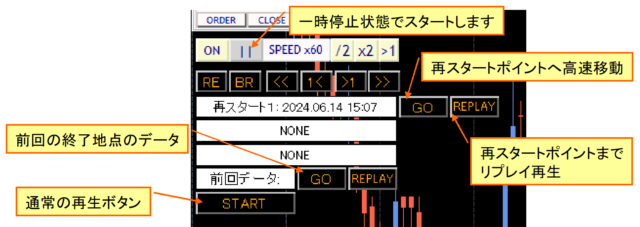
Display at startup, normal startup, restart, replay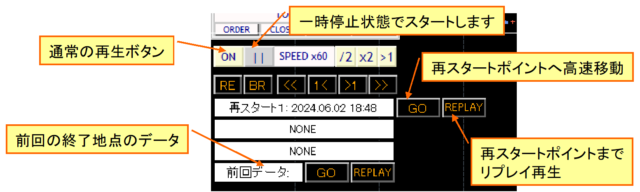
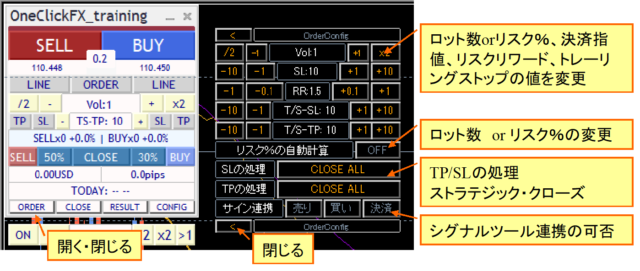
Parameter settings for One-Click FX Training MAX
| Parameter | Description |
|---|---|
| GoGoJung Member ID | Enter GoGoJungle Member ID for license authentication. Available to purchasers only. |
| Focus indicator 1,2,3 | Choose three indicators for profit, PIPS, and risk% respectively. Indicator 1: left of control box, Indicator 2: right of control box, focus mode, Indicator 3: center of chart right edge (NONE hides) |
| Initial value for automatic lot calculation | If calculating lots from risk% automatically, true |
| Initial lots / risk%, increment | Set the initial value and increment for lot size or risk% |
| Server orders | Choose whether to place TP/SL shown on the line, or SL only on the server. First TP/SL and initial SL are set only at the first order; afterwards changing TP/SL lines does not alter the order contents.If server orders are ON, all Strategic Close TP/SL lines become invalid. |
| Stop loss line = SLpips (minimum 1) | Specify initial PIPS from Break-even line to the settlement stop line. This value excludes the spread. Settlement stop is the specified stop-line plus spread. |
| Risk-reward | Specify how many times the difference between Break-even line and settlement stop (SL) is used to set the initial take-profit (TP). For example, if SL is 100 pips and risk-reward is 1.5, TP initial value is Break-even line plus spread, multiplied by 1.5. |
| SL/TP trailing stop | Trailing Stopis automatic up-moving based on tool control. Specified in pips. |
| ▼ SL settings (settlement stop) | |
| SL processing | Specify how Strategic Close handles when settlement stop is reached. |
| SL partial-close rate (held lots %) | Specify the percentage for partial settlement. |
| SL trailing stop type | Trailing stoptype to use. |
| ▼ TP settings (settlement take profit) | |
| TP processing | Specify how Strategic Close handles when TP is reached. |
| TP partial-close rate (held lots %) | Partial settlement percentage |
| TP trailing stop type | Trailing stoptype to use. |
| ▼ Individual settings | |
| Turn on TP/SL line when order/filled | When pressing the order button, TP/SL lines are set to default. If you turn TP/SL off after placing a limit order and it gets filled, TP/SL will turn ON. |
| Strength of Entry Assist | Entry Assistconfigures the strength. Default is disabled. |
| Force settlement from keyboard input | Press specified key to settle all positions. Default is disabled. You can set any combination with SHIFT+CTRL+ALT. Be aware keyboard layouts may differ; test compatible keys beforehand.Replay speed upper limit decreases. |
| Maximum number of positions | Limit on number of positions you can enter. Some brokers may impose limits. Zero means unlimited |
| Maximum size of one position (zero unlimited) | Auto-split order size at entry |
| Use ASK line | If true, emulate BID line with ASK. If false, adjust for spread and display as normal line. Note: large spreads may cause discrepancies |
| Tolerance slip page | Specify allowable slip in points |
| PIPS=>points conversion factor | Value to convert PIPS to points. For FX, zero auto-setting is fine. For CFDs, adjust by broker |
| Forced settlement time Initial value for forced settlement |
Change as needed. If a position exists, settlement occurs at the specified time and pauses. If initial value is true, ON |
| Order time Start time, end time Initial order time |
Specify the allowed trading window. From start to end, entry orders are sent to the server. Outside these times, entries via buttons are not accepted. Settlement orders and limit orders are not included. If initial value is true, ON |
| ▼ Speed settings | |
| Initial speed index | Specifies which speed in the speed list to start with. |
| Speed list | Comma-separated speed multipliers for speed adjustments. 60 means 1 second = 1 minute, 3600 means 1 second = 1 hour, 14400 means 1 second = 1 day, up to a max of 604800 (7 days). Note: cannot exceed the tester's max speed. If speed control is OFF, the tester's configured speed is used (maximum playback speed). |
| Initial value for order execution pause | Pause at execution via speed control. Resume with speed control playback or ON/OFF control. |
| Initial value for pause on signals | While signals are active, pause with speed control without entering trades. Press play to resume when ready. |
| Automatic stop time | Change as needed. Chart stops automatically at the specified time. Works on charts H1 or lower. If initial value is true, ON |
| Replay initial value | ON if true |
| History save initial value | ON if true |
| Response speed (ms) | Minimum unit for chart operation and synchronization. Usually no need to change, but if using high-resolution displays (4K+), adjust to reduce lag. 10-100 is a comfortable range. |
| Keep fixed chart objects | When changing a fixed chart, keep original objects (like trendlines). Set to true if you want to resume with objects included from the save point. |
| ▽ Display settings | |
| GMT offset for connected server Daylight saving time |
If MT4 displays as-is, use it. To adjust to Japan time, set offset to 2 and enable daylight saving (depends on the connected server). Please confirm. |
| Display of final time | Show final tick time in the control box. If you adjust server time offset, show the adjusted time. |
| Trade image saving Image size width x height |
When a trade is executed or daily aggregation is performed, save an image. Choose none, full screen, or the target chart. After tester ends (stop button pressed), open the folder containing saved images. Images are overwritten each time; copy to another location if needed. |
| Show trade history marks | Display MT4's standard entry and settlement triangles and lines |
| ▽ Output settings | |
| Set the maximum number of data bars for AI output. Note: number of candlesticks | |
| AI output bar margin | Set the number of leading/trailing bars for AI output data. |
| ▼ Settings for Signal Tool integration | |
| While signal integration is active and you hold a position, if a signal in the opposite direction occurs, specify how to handle it: place the hedge as is, close current position, close and reverse (do double order), or take no action. | |
| Initial values for buy/sell/close signals Initial values for sell signal Initial values for close signal |
Set initial ON/OFF for integration: ON (true) or OFF (false). |
| ▼ Signal Tool integration (object) | |
| Buy signal object name Sell signal object name |
Enter the object names that the signal tool will display. If partial match, considered target signal. Default: ArwUP, ArwDN areOne-Click Auto Arrow Trading and includedSignal Arw Tool provide default arrow values.You can specify multiple strings separated by commas. All conditions must be AND. |
| Signal time target | Specify whether the signal targets the latest bar (0) or past bars (1 and up). If repainting on the latest bar is desired, enter confirmation for the previous bar (1). |
| All-close signal object names Buy close signal object name Sell close signal object name |
Enter the object names displayed by the signal tool. Partial matches count. Defaults: ArwCL, ArwCUP, ArwCDN correspond toOne-Click Auto Arrow Trading and the includedSignal Arw Tool |
| Signal close time target | Specify whether the signal targets the latest bar (0) or past bars (1-). If repaint on latest bar occurs, enter confirmed previous bar (1). |
| ▼ Signal Tool integration (index) | |
| Buy signal index Sell signal index |
|
| Signal time target | Specify whether the signal targets the latest bar (0) or past bars (1-). If repaint on latest bar occurs, enter confirmed previous bar (1). |
| Indicator parameters 1-8 | Enter indicator parameters in correct order as integers, decimals, strings. Values after END use defaults. If a string parameter is numeric, prefix with a single quote. |
| ▼ Notification features | |
| Notification settings [Common] | |
| true: start minimized. false: start at normal size. | |
| Varies with screen size; if content does not fit, reduce values. | |
| Position of the control box. | |
| Fine-tune the control box font size. Depending on display size and Windows font scaling, MT4 font size may be too large or too small; adjust here. 1 means 100%. | |
| Font size of text shown on the chart. | |
| Thickness of TP/SL and Break-even lines on the chart. Dashed lines when not committed have a fixed thickness of 1. | |
| Size and display time for messages shown at the bottom-left of the chart. | |
※ Parameters use only values. Start/Stop/Step are not used.
■Details of features
Automatic calculation by risk %
The number of orders is automatically calculated from the margin you hold and the risk%.
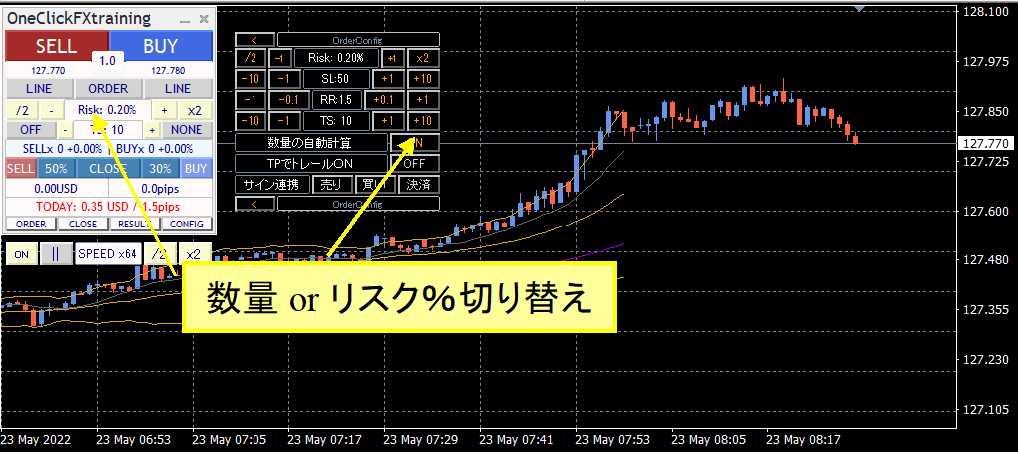
You can switch this in the control box quantity field or in the sub-panel "Automatic Quantity Calculation".
If you place a market order without TP/SL lines visible, the order quantity is calculated from the initial SL value based on the specified risk%. If TP/SL lines are visible, calculation uses the order price and the SL line price. Note that turning TP/SL lines on/off resets to default values and the auto-calculated order quantity may not align with SL line.
TP/SL lines
Use the LINE button on the control box to show TP/SL lines.
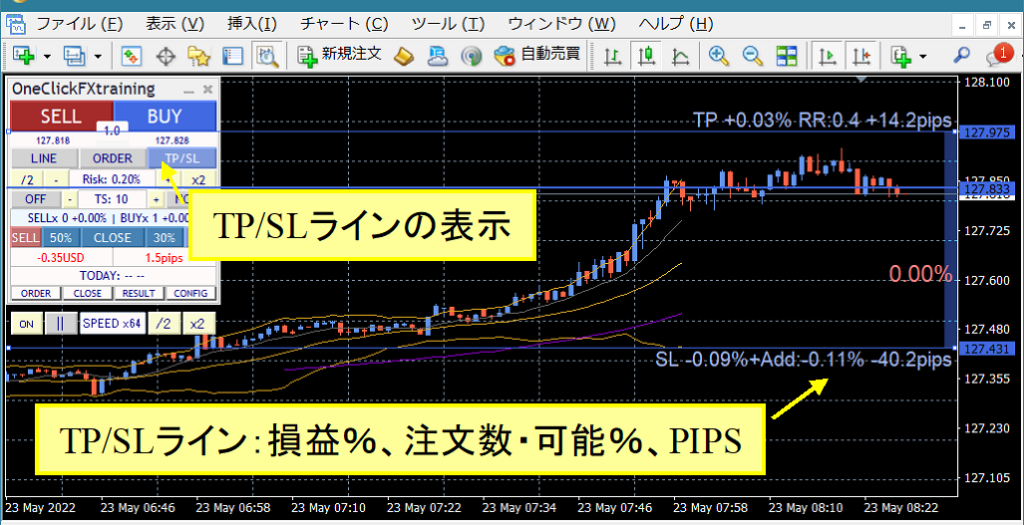
If you hold a position, the P/L percentage at settlement, the eligible order percentage from current price, and PIPS from Break-even are shown. If you hold no positions, only the eligible order percentage and PIPS from current price are shown.
When the LINE button is ON, lines are drawn based on the initial values for SL and risk/reward. Toggling LINE ON/OFF returns to initial values.
If TP/SL lines are OFF, no settlement occurs.
Limit orders
Display the limit order line via the control box ORDER button.
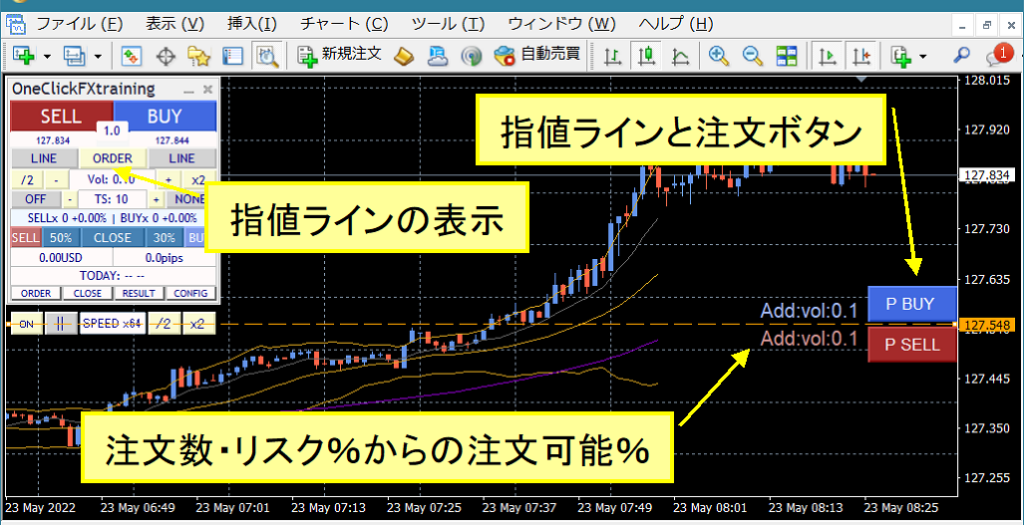
The order button shows when TP/SL lines are visible for SELL/BUY. If BUY TP/SL line is not visible, P BUY button will not appear. Next to the button, the order percentage or risk% eligible is shown. If n/a, you cannot add orders.
Strategic Close
When TP/SL lines touch, Strategic Close can trigger multiple actions.
When the TP/SL line is reset, the current price-based parameters reapply and TP/SL lines are re-set.
If SL line value is 10 pips and a Strategic Close is triggered on the SL line, the SL line will move by 10 pips from the current price baseline.
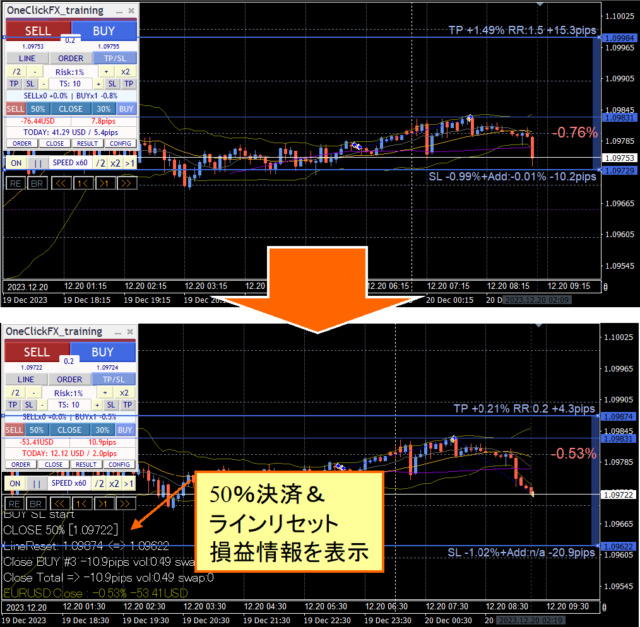
Similarly, TP line resets according to SL line risk word, but resets only up to the Break-even line.Note: If you choose line reset without any partial settlement, SL line may continue to move downward, please be aware.
Flexible Trailing Stop - FlexiTrail Stop
TS blocks on the operation panel can toggle each trailing stop ON/OFF. There are four trailing stops: TP for SELL, SL for SELL, TP-TS value, and SL for BUY/TP for BUY, controlled separately for the four trailing stops.
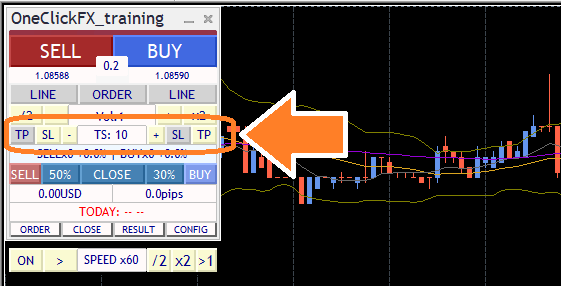
If clicking a button has no response or it returns, you may be in a state where Strategic Close is setting trailing stops. They turn ON when TP/SL is reached, so until then they are OFF.
Trailing line is shown in purple when you hold a position. When OFF, it is dashed; when ON, it appears in practice. The maximum value detection occurs at activation, unlike earlier versions. Toggling ON/OFF causes re-calculation from the current maximum value.
• None: NONE
Do not use trailing stop.
• Fixed: FIX
From the time it turns ON, when the price falls below the specified value from the high, it will settle like a standard trailing stop.
• Shrink: SHRINK
Similar to FIX, but compares highs at price updates or every tick; if no new high is reached, TS value converges toward the set width over iterations. If a new high occurs, it returns to the TP or SL value. If prices drop after a high, trailing lags but provides time for recovery.
• AVG: AVG
At activation, base value plus current price increments form average trailing stop. Higher TS values result in slower following of the current price, lower TS values track more closely. AVG has no reset and tends to align with price movement, potentially closing positions quickly in fast markets.
• MA: Moving Average
Close positions when price touches the moving average line of a specified period (e.g., MA20).
• BB: Bollinger Bands
Close positions when touching upper/lower bands of the specified period. For long, touch lower band; for short, touch upper band. As with MA, the TS value is the period (MA20, etc.). Deviation 2 is fixed and not adjustable.
• SAR: Stop & Reversal Point (SAR)
Close positions when touching Parabolic SAR with specified step. Parabolic SAR by J. W. Wilder, indicates reversals. TS value is in 1/1000. Default 10 is 0.01; 1 is 0.001. Use alongside standard indicator values for reference.
• Chandelier Exit
Chandelier Exit uses ATR to widen stops in volatile markets and tighten in calm markets to follow trends while avoiding excessive take-profit or stop losses. TS value is 0.1x, fixed ATR period 14.
• Protect BE (ProtectBE)
When price surpasses Break-even line and reaches TS+ATR value, push the TP/SL line closer to profit. It tracks with additional orders moving Break-even line, used mainly to prevent losses after profits are secured.
This video compares general fixed trailing stops with Shrink L. Both follow highs; Shrink moves closer to the current price if highs are not updated.
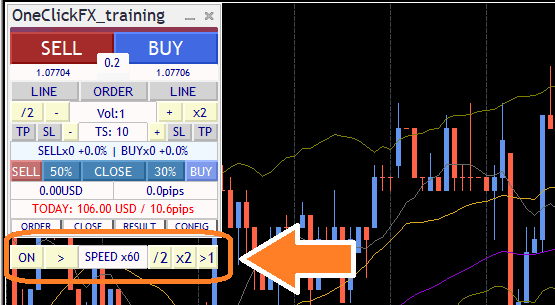
Speed Control
The speed control in the bottom of the control box can be adjusted using the values in the Speed Control speed list parameter.
Click the SPEED part to advance one tick; the rightmost >1 button moves to the next candle and stops at the first tick after switching.
Speeds range from 1x (1 second = 1 second) to 60x (1 second = 1 minute), 3600x (1 second = 1 hour), 14400x (1 second = 1 day), up to 604800x (7 days). However, it cannot exceed the tester's maximum. If speed control is OFF, the tester's configured speed is used (maximum playback).
Computer performance and added indicators or signal integrations may slow operation. To use Speed Control smoothly, move MT4's speed gauge to the far right (fastest) before use.
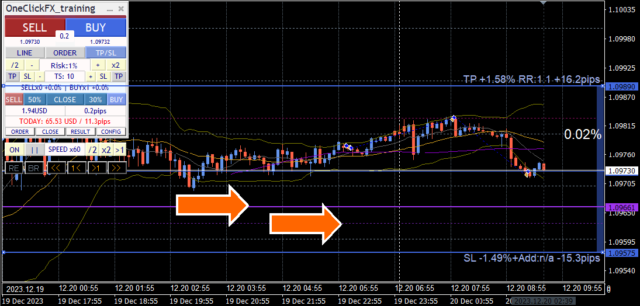
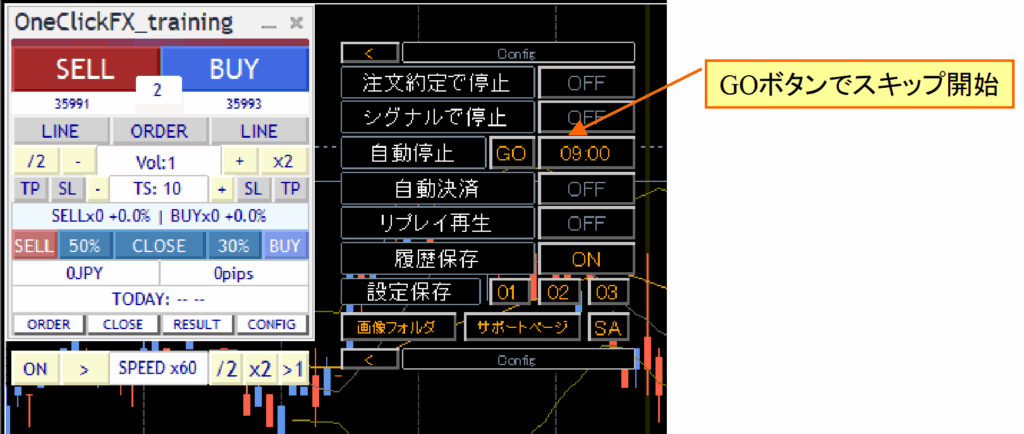
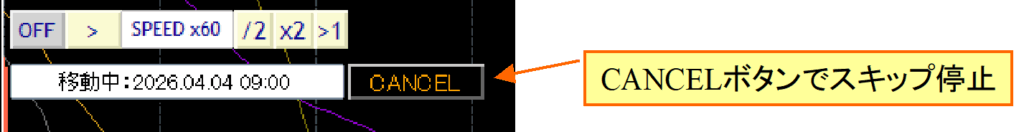
Fast Skip
A feature to fast-forward the chart with a single click. Skips to a later time quickly until the set stop time or up to a year ahead. This can improve efficiency for daily practice or testing at fixed times.
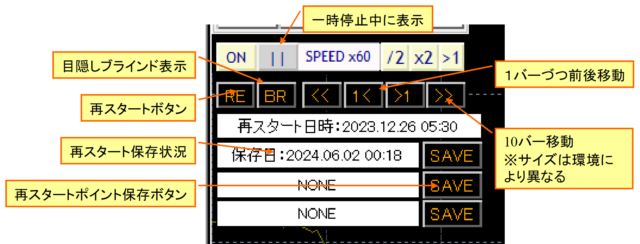
Past Verification Viewer - TheWorld-
When speed control pauses the chart, additional control buttons appear below speed control. These are the past verification viewer controls.
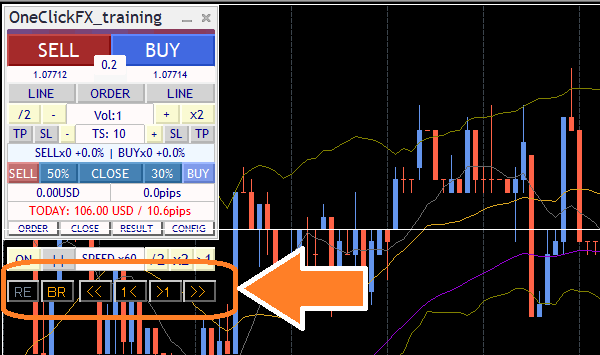
A faint synchronization line appears on the chart, and synchronized charts share the same time. The chart can be scrolled left/right; moving the main chart with mouse or keyboard synchronizes the synchronized chart's line accordingly.
Press "1<" or ">1" to move one candle; "<<" or ">>" moves about ten candles. The number of candles moved depends on zoom level and environment.
The "BR" button is the Blind ON/OFF button. Turning on blindness hides later candles from the synchronization line.
The chart with blindness on is above, blindness off below.
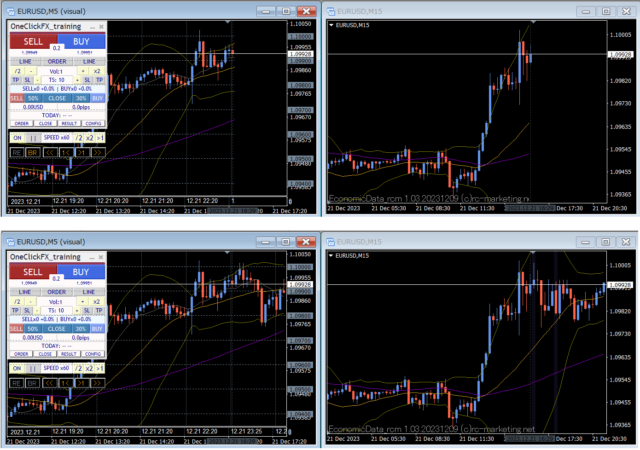
With blindness, you can review past charts and predict ahead, noticing significant differences in thinking depending on what you can see.
Restart - TimeLeap-
Pause the chart and press the leftmost "RE" button in the Past Verification Viewer; a panel appears. There are three save locations, and you can save the current state to any of them.
After stopping, pressing the Start button shows a restart point selection screen.
Press the "GO" button for a saved number to jump to that point with fast forward; the "REPLAY" button replays the same order at normal speed.
Previous data reproduces the last finished data. Not only at the pause point but when scrolling back in time, the synchronization line moves to that point; you can save that point as a restart point.
This video shows saving a restart point at the time just before settlement after stopping, then restarting and continuing from the previous data.
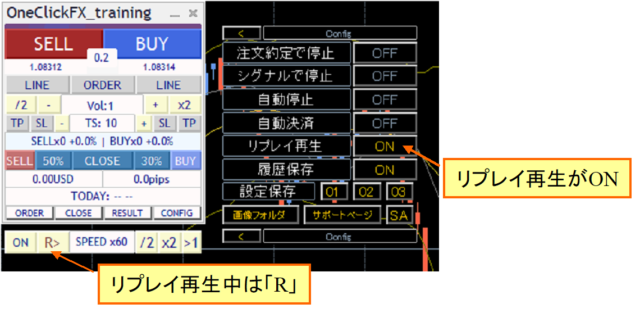
If you press the Replay button, replay using saved order information. During replay, the sub-panel's replay playback turns ON and the speed control playback/ pause button shows "R".
Automatic image saving
If you set trade image saving to true, images are automatically saved at entry and settlement. When the date changes, the previous day's trading is saved as a single image. The images saved are like the following.
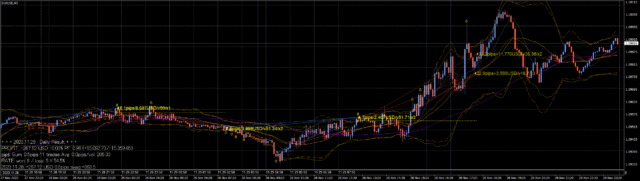
When tester ends (stop button pressed), the folder where images are saved opens.
Save location is tester/files/OshiraseSnap inside the data folder.
※ Please also copy the tester folder from the product file.
Saved image files are overwritten each time the tester starts, so if you want to keep copies, please save them to a separate location.
Daily aggregates results display
Open the sub-panel to see yellow lines for past trades and the PIPS results.
Also, clicking the date or TOTAL in the RESULT sub-panel shows the aggregated results.
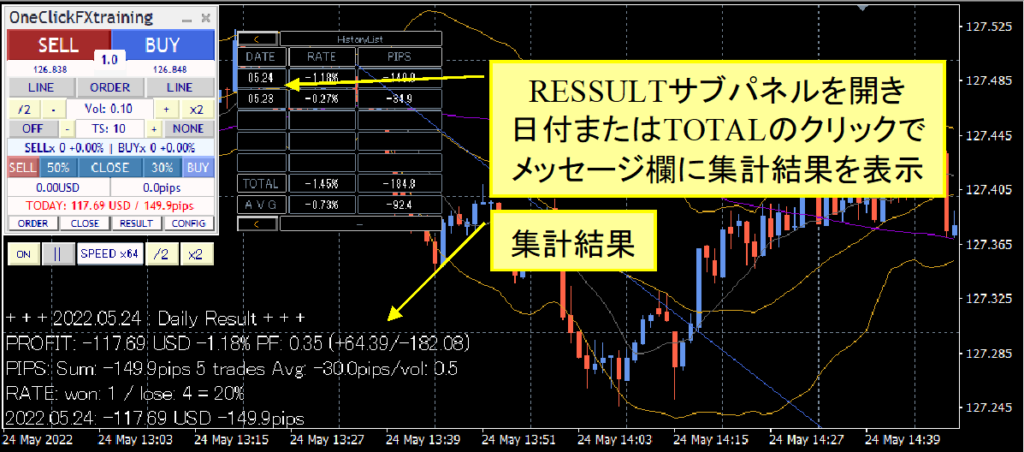
Even during ongoing aggregation, you can view the current status.
Clicking headers changes the aggregation unit to daily/weekly/monthly or to 10 items/100 items. RATE shows PROFIT, PIPS show PIPS/vol, PIPS/trade, etc.
Entry Assist
The Entry Assist guidance is based on detecting fluctuations from ASK, BID, and the mid-price to predict price movement a few seconds ahead.
Using this judgment, after pressing the entry button, trading orders automatically pause at the optimal timing.
There are three strength levels: weak, medium, strong. Choose from weak, medium, strong, or disabled.
Roughly, the following scenario for a buy entry occurs:
Weak: when price movement has paused (stopped falling)
Medium: reversal has occurred, rising tendency started
Strong: price is rising clearly
The Entry Assist judgment status can be seen in the color bar at the top of the control panel.
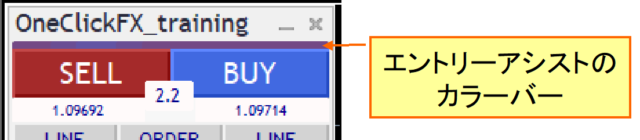
If the color bar is close to BUY color, it indicates a buy verdict; if close to SELL color, a sell verdict.
In the tester, spreads are fixed, so color differences between left and right may not appear, but some brokers may show different verdict colors.
If the strength is set to weak/medium/strong and you press the entry button, the button becomes dim and Entry Assist waits for timing. Press again to force entry; press Cancel on the lower part to cancel entry.
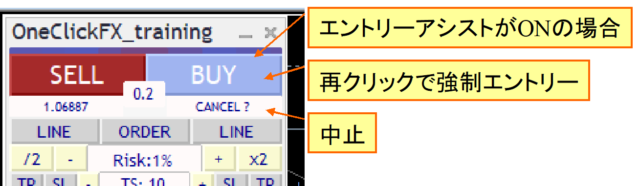
If you set the strength to strong, entry may not occur until the price clearly rises, which can lead to waiting long time. Adjust to market conditions. Note that testers or brokers with fixed spreads may limit effectiveness.
AI Judgment (AI Export)
You can output trading data to AI-friendly format. By feeding this data to an AI, you can obtain trading assessments or predictions from AI.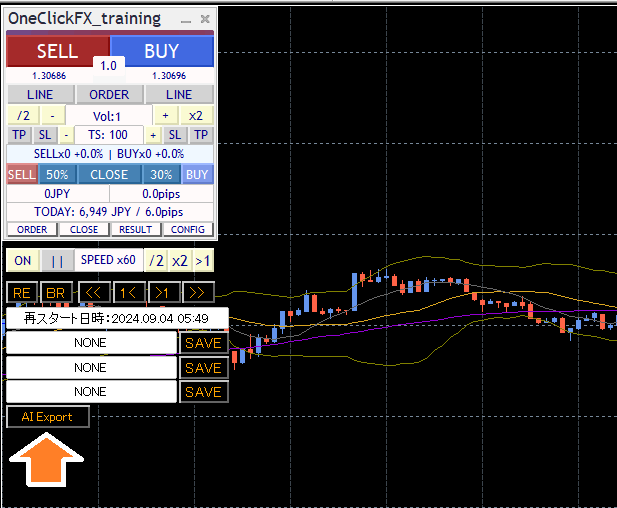
Pause the chart, press the RE button, and use the bottom-right "AI Export" button on the function panel to open a folder and output AI-ready data. Upload this data to various AI generators for use.
From the clip icon, please upload the file.

If the upload completes successfully, it will be shown here.

After AI reads the data, try asking a variety of questions.
For example:
“Evaluate and analyze the trade details,”“Check if my moving average cross entry is correct,”“Plot it on a chart and add a 75 moving average,”“Explain the cause of a large loss and how to avoid it,”“Where would be the correct place for a stop, explain logically,”“If you were to rate it, what score would you give?”
AI responses range from appropriate to completely off-target or unintended. Consider whether the content is truly correct. Treat it as one opinion among many.
To elicit better answers, ask specific questions. For example, asking “How to win in FX” yields vague generic responses. Be explicit about what you want to do. Just as you feed transaction data to AI, you should provide your own information to AI as well.
For reference, sample data of this conversation are shown here.
ai_ssample01、ai_sample02、ai_sample03
※ These samples are output using ChatGPT Plus.
A good thing: AI will not get angry if you ask the same question many times. If you don’t understand, continue asking. Sometimes it may be impossible, but it will usually provide some answer. You can push it with bold requests; if you provide correct information, it will respond accordingly. If normal responses are all you get, provide more specific information and refine your request.
※ If you use a free AI for analysis, you can load only history.csv to reduce the data and have longer conversations. For deeper analysis, consider paid options.
Note: AI analysis requires a free AI (perplexity.ai, wrtn.jp, ChatGPT) or ChatGPT Plus ($20/month). AI Judgment is a tool for evaluating trades and does not provide investment advice. Data and analysis results are for reference only and do not guarantee all trades or future performance. Please make investment decisions at your own risk.
Economic indicators
Embedded indicators are displayed on the main and synchronized charts viaEconomic Indicators Display [EconomicData_rcm]. Hover over the colored lines to see the economic indicators announced at that time. By default, indicators related to the currency pair shown are displayed.
If the economic indicator time differs, in simple synchronization it is automatically adjusted; in main and active synchronization, manual adjustment of the server time offset may be required. The default offset corresponds to summer GMT+3 and winter GMT+2 for typical setups.
Support Assistant
A convenient feature that automatically collects information with one button when you need support.
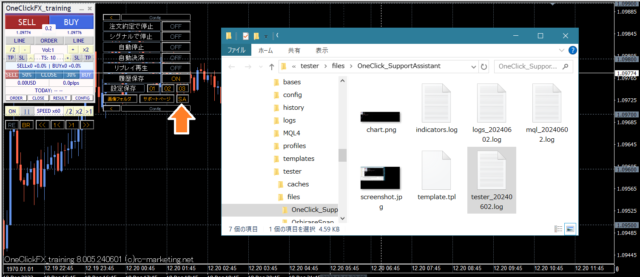
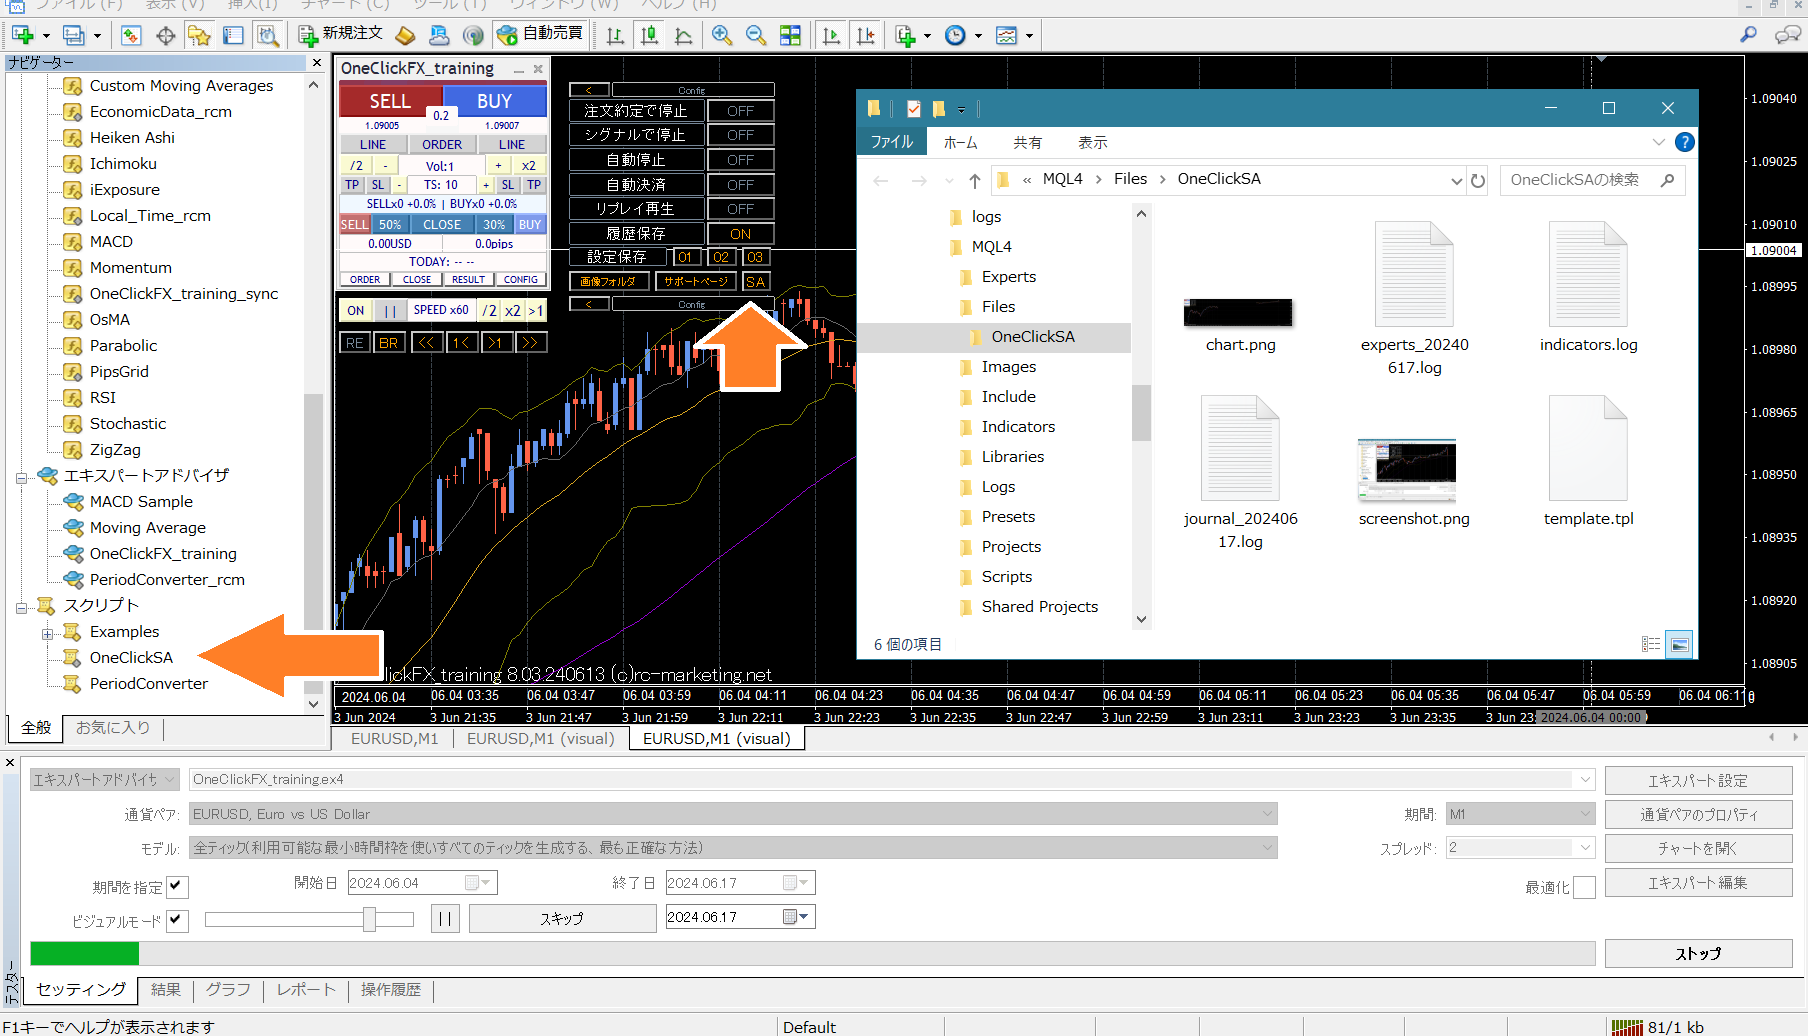
Press the SA button or double-click the OneClickSA in the Script folder to collect information; a folder will open, and please send the output files by email.
If you contact us via the form at the bottom of the page, please attach the automatically generated email confirmation after you submit the form.
■Sub-chart synchronization settings
There are two types of synchronization sub-charts.
1. Simple synchronization using normal online charts for easy switching
2. Active offline charts for near real-time display using active synchronization
Simple synchronization uses standard online charts; if past data is prepared, specify the fixed chart and synchronization starts easily. Time frame and currency pair can be changed just like online charts.
However, shift-based indicators may cause the chart start to be hidden, and some indicators in sub-windows may be unavailable due to bugs. There are workarounds but some limitations exist.
Active synchronization creates dedicated offline charts, updates online charts on the fly, and displays similarly, but some indicators are not supported offline, and updates can slow operation.
Both have pros and cons; choose the chart that suits you.
Simple synchronization
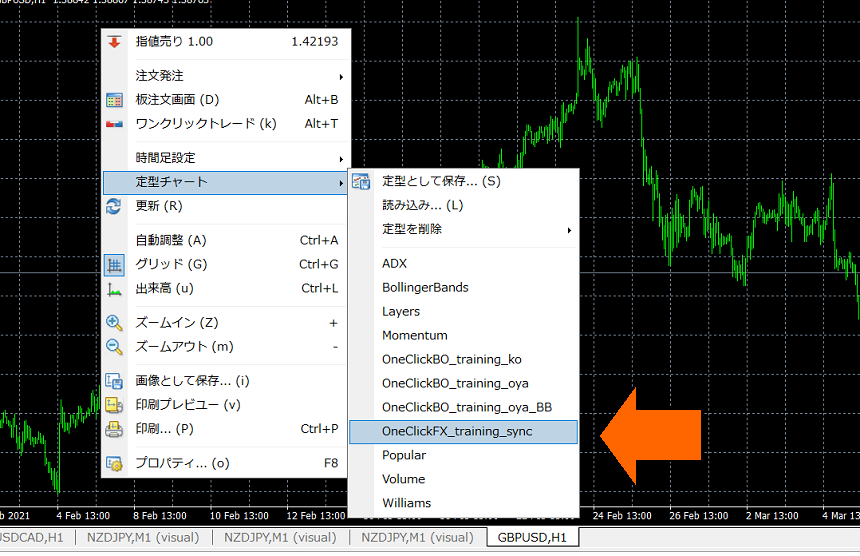
1) Open a chart for any currency pair
2) Right-click => Fixed Chart => OneClickFX_training_sync
3) If needed, change parameters and OK
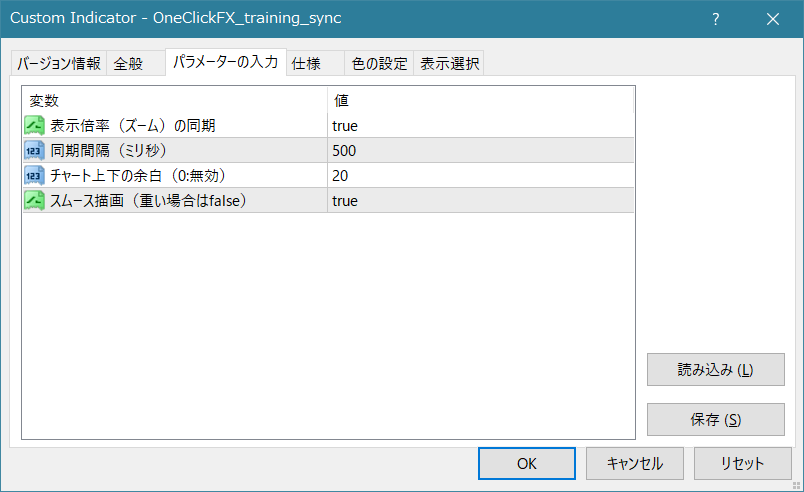
- Synchronization of display scale (zoom): align main chart scale with sub-chart
- Synchronization interval (milliseconds): set when to synchronize with main chart
- Top/bottom margins: auto-adjust chart height (fixed); disable with 0
- Smooth drawing: TP/SL lines display instantly. If performance is an issue, set false
4) Charts become synchronized
※ If speed is too high, synchronization may be deferred
Active synchronization
1) Open the chart for the currency pair to be synchronized
2) Display the target time frame
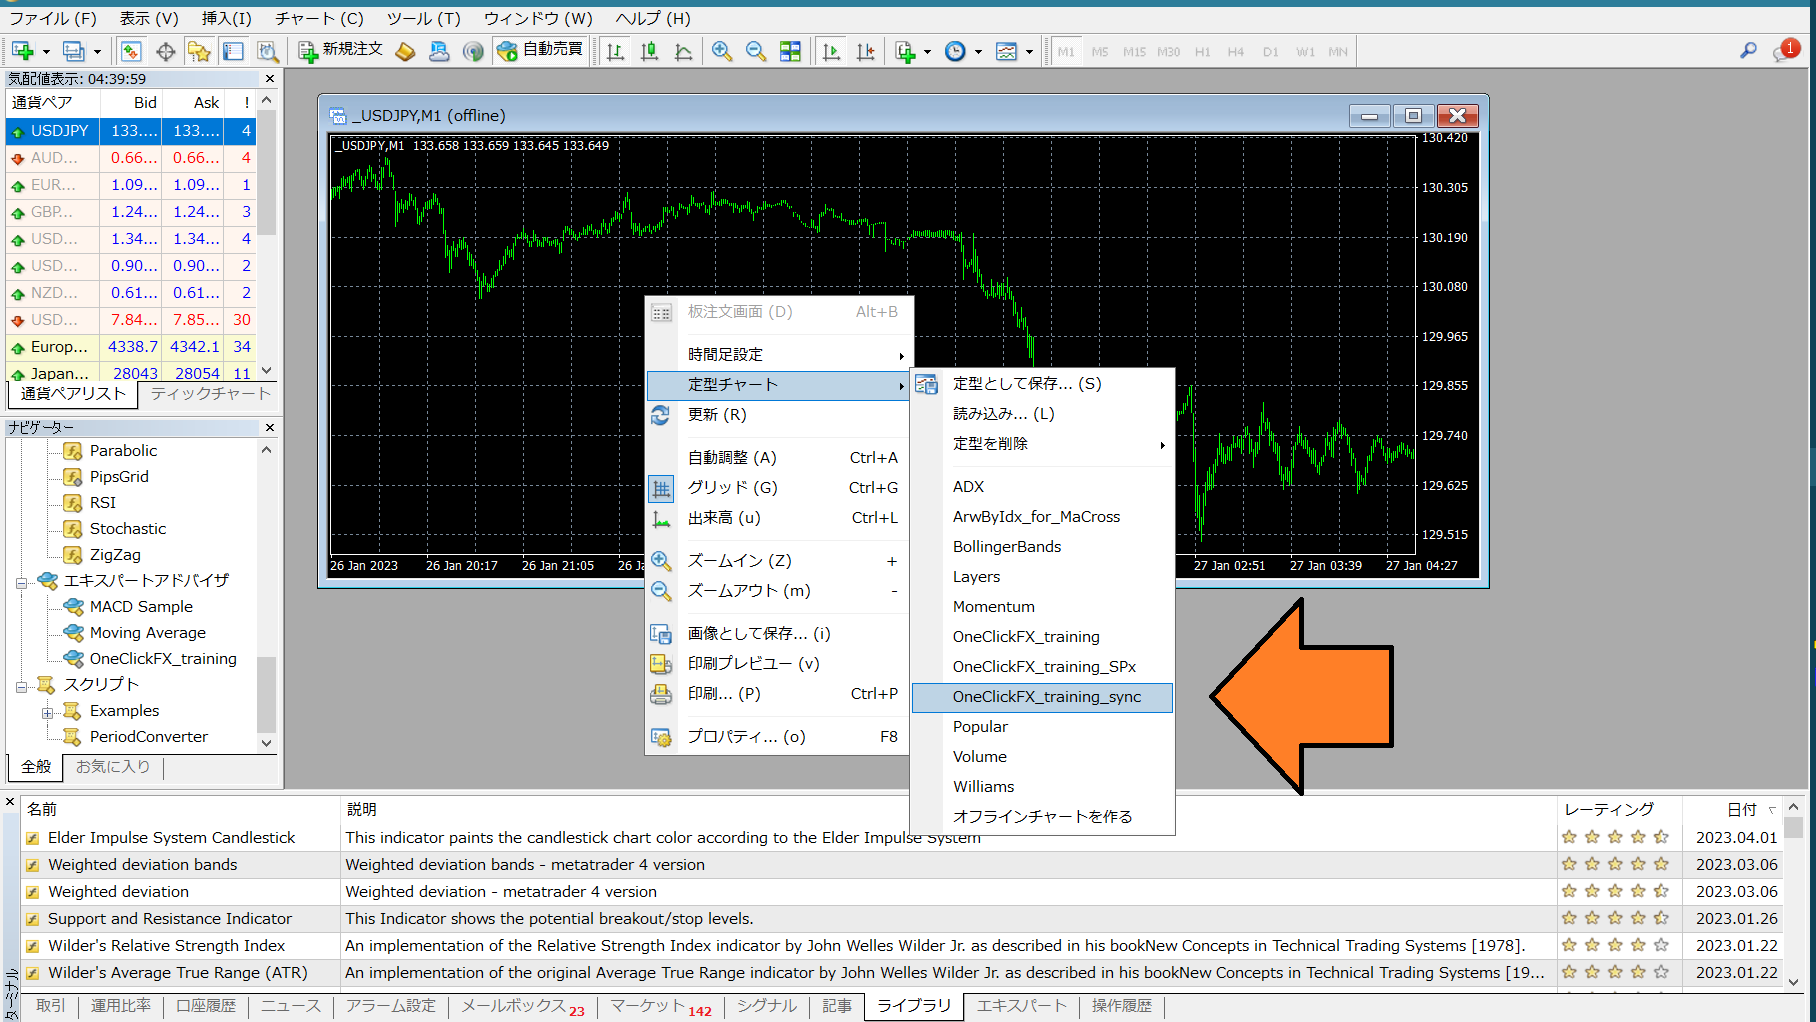
3) Right-click => Fixed Chart => "OneClickFX_training_sync" and select. It will display "Active offline sync ready".
If syncing other timeframes, change the time frame and confirm "Active offline sync ready" for each.
※ This step is only required the first time; not necessary thereafter
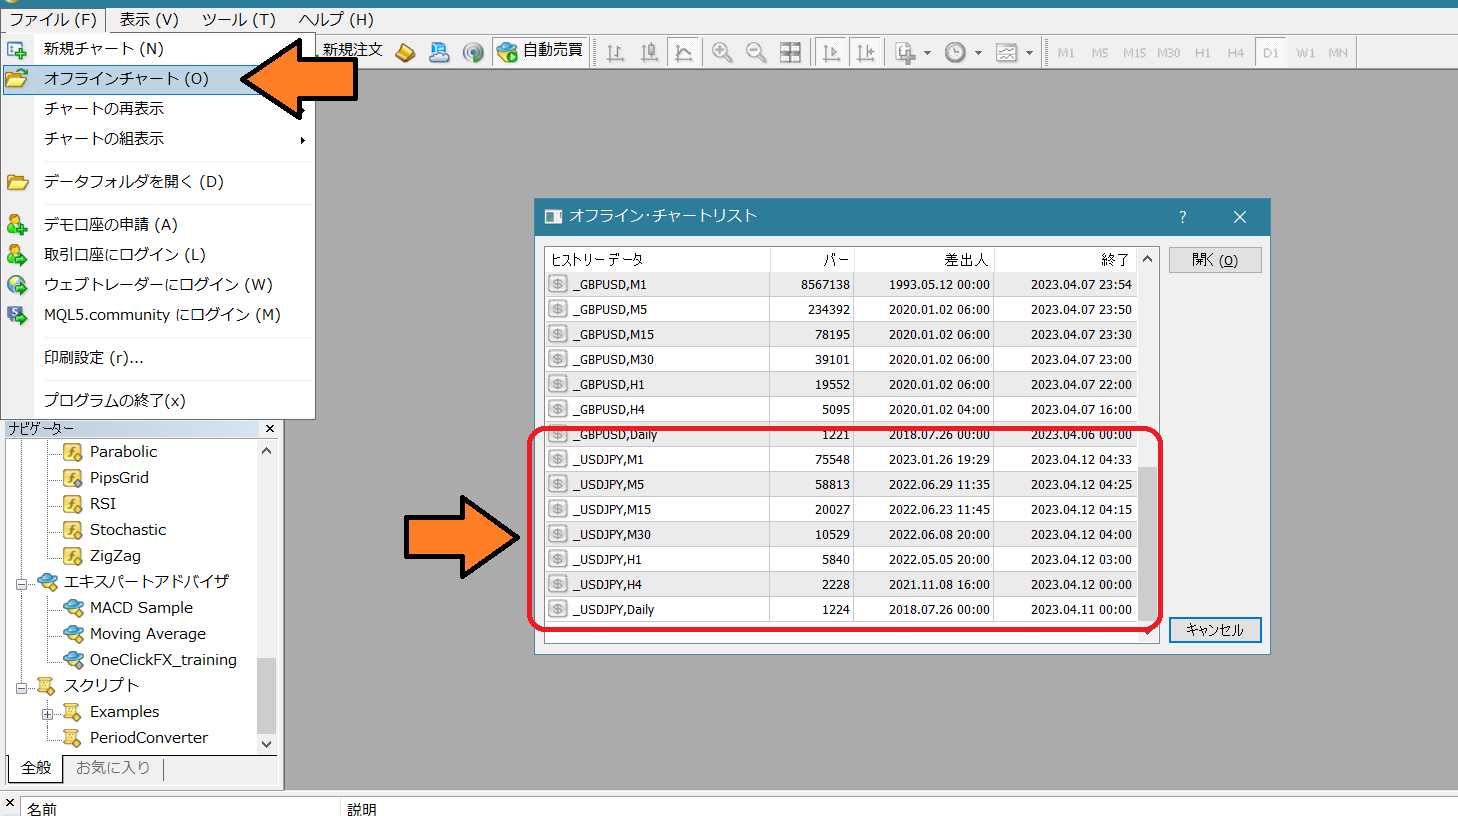
4) From the File menu => Offline Chart, open the first character chart starting with "_" (underscore) (e.g., _USDJPY 1 minute to daily).
5) Right-click => Fixed Chart => OneClickFX_training_sync
6) As with Simple synchronization, adjust parameters if needed and OK. The chart will synchronize.
■Integration with Signal Tools
One-Click FX Auto Arrow Trading simple integration and includedSignal Arrow Tool (free version) enable integration with arrows from other signal tools to enter trades or enter on chart changes like Golden Cross.
Integration via One-Click FX Auto Arrow Trading
1. Add a compatible signal tool to the chart.
2. Turn on the buy/sell buttons for signal integration.
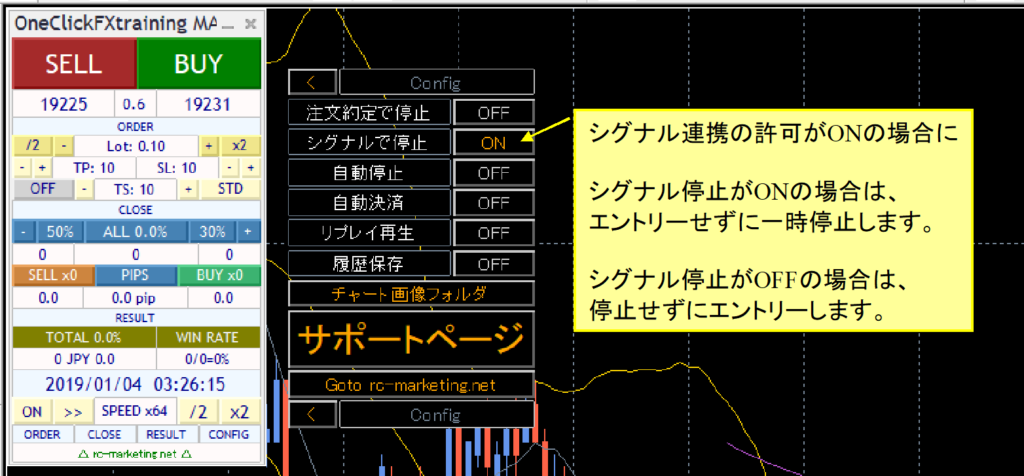
Signal integration has two modes. If the signal parameter triggers pause or CONFIG signal PAUSE is ON, entry is paused with speed control. If OFF, entry continues. When Pause is ON at signal, you can analyze trades and then resume with speed control or ON/OFF.
Turn OFF the leftmost speed control button to accelerate speed to the maximum; if arrows do not appear, try to fast-forward to where they would appear.
Integration via Signal Arrow Tool
Signal Tool integration can be done via the aforementioned One-Click FX parameters or by using the includedSignal Arrow Tool (free version).
Signal Tool Arrow Tool (ArwByIdx_rcm) can enter trades with arrows produced by other signal tools or enter on chart changes like Golden Cross.
There are bonus sample presets included for you to try
Also, enclosed are sample fixed charts you can try.
ArwByIdx_for_MaCross.tpl … Moving Average Cross
After starting the tester, right-click => Fixed Chart and choose the above fixed charts.
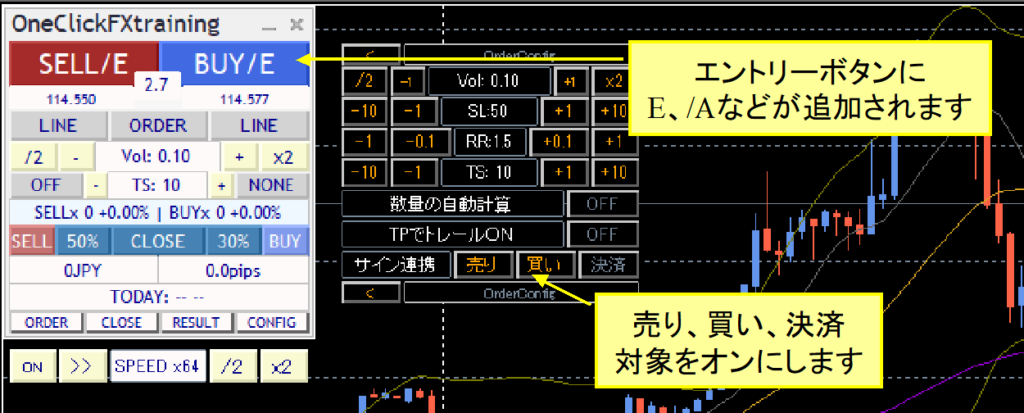
In the order sub-panel, enable sign integration (sell, buy, close) so that /E (or /A) is added to the button.
Complex condition signal integration
The following sample fixed charts are included with the product.
OneClickFX_training_SPx… complex conditions with multiple signals
This fixed chart integrates three signals: moving average cross, MACD cross, Bollinger Band breach.
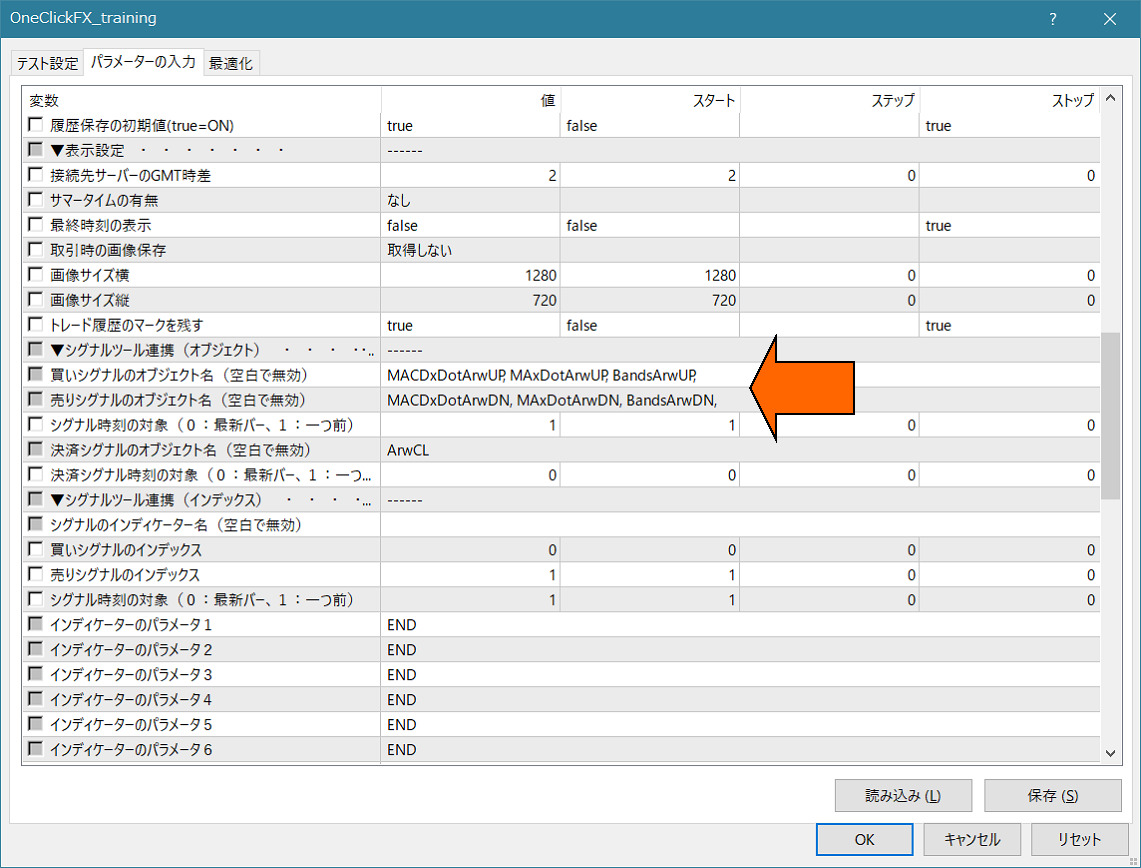
Change integration for OneClickFX_training signals as follows.
Sell signal object name: MACDxDotArwUP, MAxDotArwUP, BandsArwUP,
Buy signal object name: MACDxDotArwDN, MAxDotArwDN, BandsArwDN,
Load preset OneClickFX_training_SPx.set via bottom-right load button to apply the above settings.
Set up accordingly and operate like simple integration.
Each limit displays as a dot or arrow when conditions are met; three conditions must be met for signal integration to trigger.
Modify the parameters of "ArwByIdx" and register as a fixed chart to freely modify fixed charts even during tester operation.
Feel free to experiment with combinations.
If you are unsure how to set it up, please contact us. Your existing signal tools can be integrated with most cases.
If you provide the signal tool name and parameter information, we can guide you through the setup.
■Indicators included with the product
PipsGrid Support Page■Troubleshooting & Tips
https://www.gogojungle.co.jp/finance/navi/articles/45682
・Prepare historical data
【2024版】MT4の過去データを失敗せずに準備する方法
・Want to reuse colors from V6 or earlier
Set parameter “Buy color” to Green and use.
・Profit and loss with fees
For accounts with fees, profit displays include fees, while PIPS display excludes fees. Note that fee patterns vary; not all scenarios are guaranteed.
Notes
This is a diverse market tool; we cannot guarantee full compatibility with all signal tools. Especially for password-protected products or protected signal tools, integration may not be possible. Paid options may be available for bespoke integration. This product is a practice tool; its results may not reflect actual trading outcomes. Broker price data may differ from what is displayed in this tool. For security, online authentication is done via encrypted SSL communications.
■When in trouble
If the tool is not functioning properly, behaving oddly, or stops suddenly, please first refer to this area.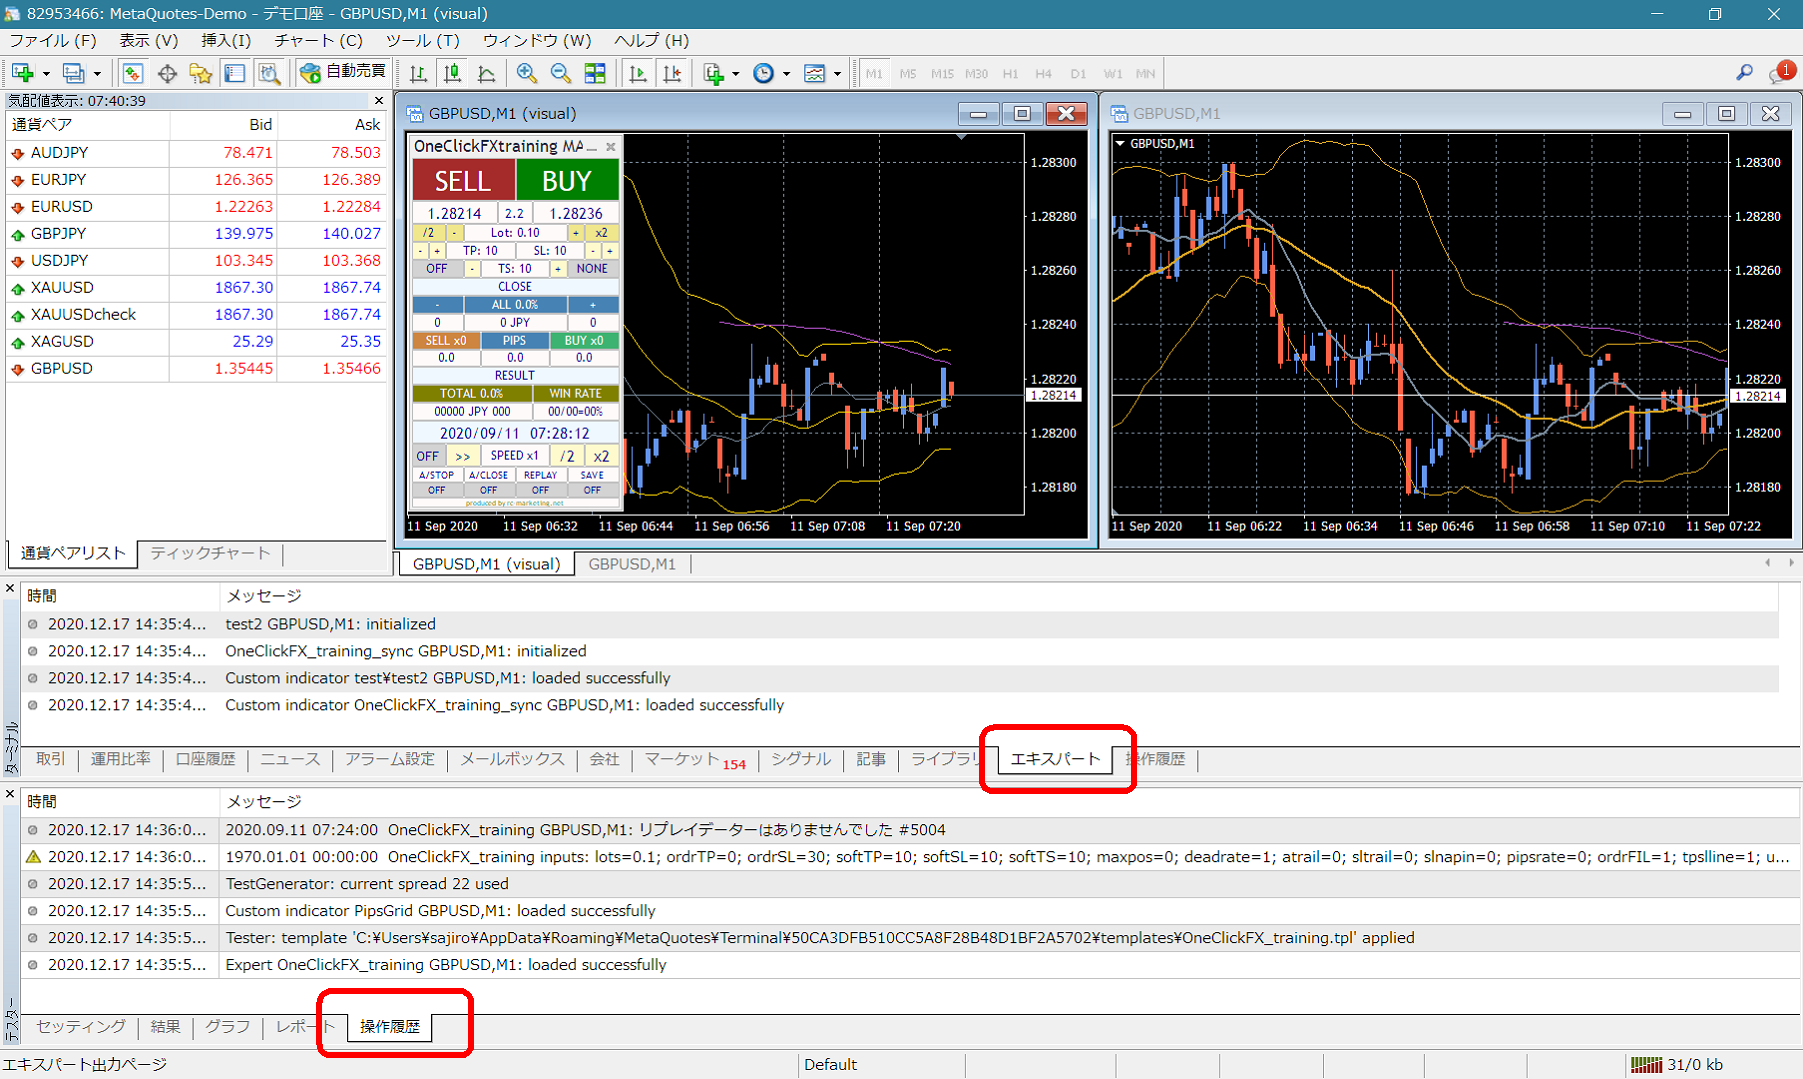 If there are error messages in the terminal's Expert or Tester operation history, please share them to expedite support. Your cooperation is appreciated.
Support Assistant
Some products include a convenient feature to collect information for troubleshooting with one button. Press the “SA” button to collect information; a folder opens. You can also double-click the Script folder's OneClickSA to do the same.
 Please attach the output files when sending.