The Noble Path of Investment (Part 9)
The Road to Investment Success (Part9)
1.
2022 year7 month-end onward: selecting the optimal currency pair in the convergence phase
By looking at the overall wave movement on the daily chart, it becomes clear that the waves that were in the dispersion phase have entered the convergence phase from the end of July 2022. The figure below is a daily chart with the “Currency Strength Visualization Indicator” installed.2022 year3 month, and the graph that began to spread in the dispersion phase is predicted to move toward the convergence phase in the future.
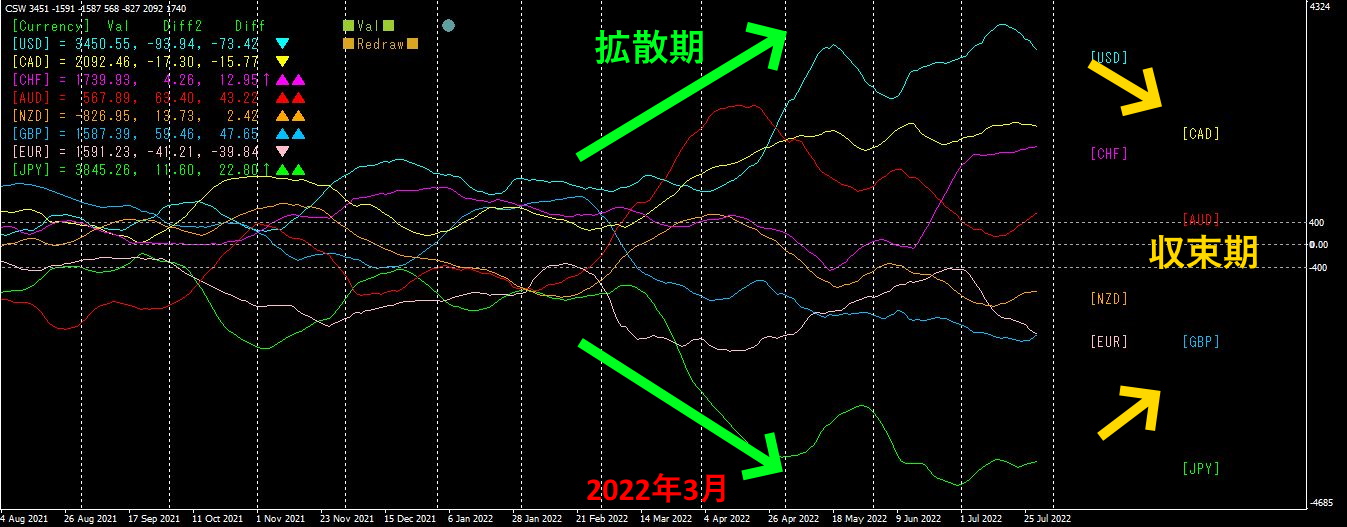
Now, among 28 currency pairs, how should we select the optimal currency pair?
By installing the “8CP Visualization Indicator” on the daily chart and lining up three sets, we select the currency pair with the maximum and minimum values for each set numerically.
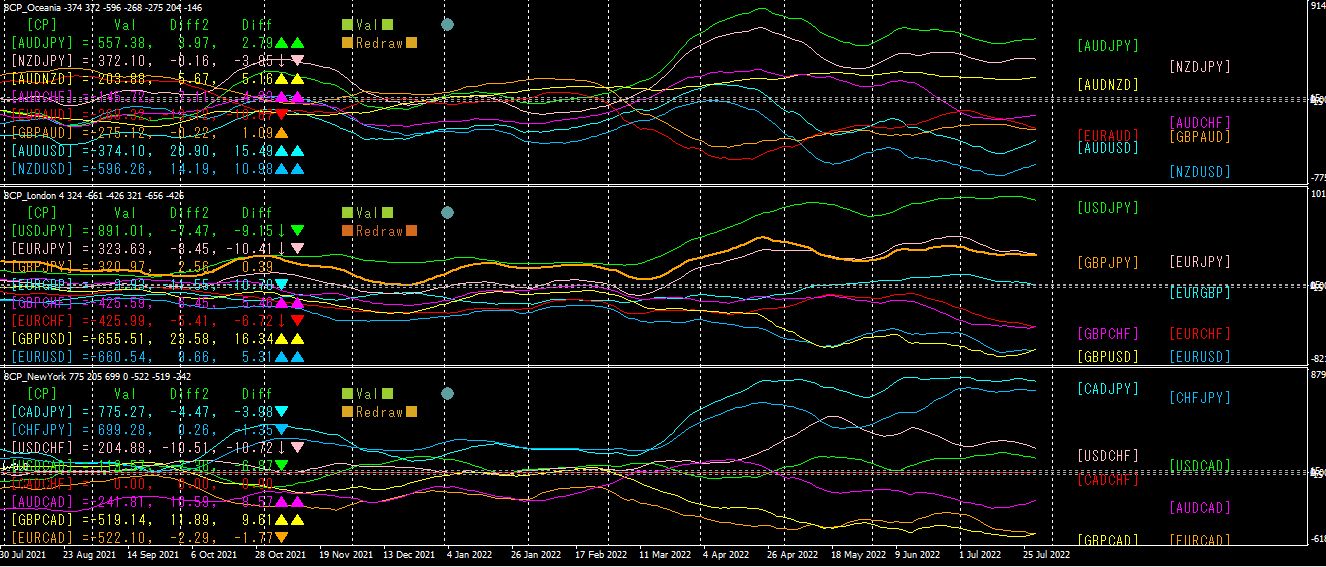
From the top, the order is: the 8CP Visualization Indicator’s Oceania version, London version, and New York version. This allows comparison of 24 currency pairs. For the remaining 4 currency pairs, display them in the “8CP Visualization Indicator” Any version with NZDCHF, NZDCAD, EURNZD, GBPNZD.
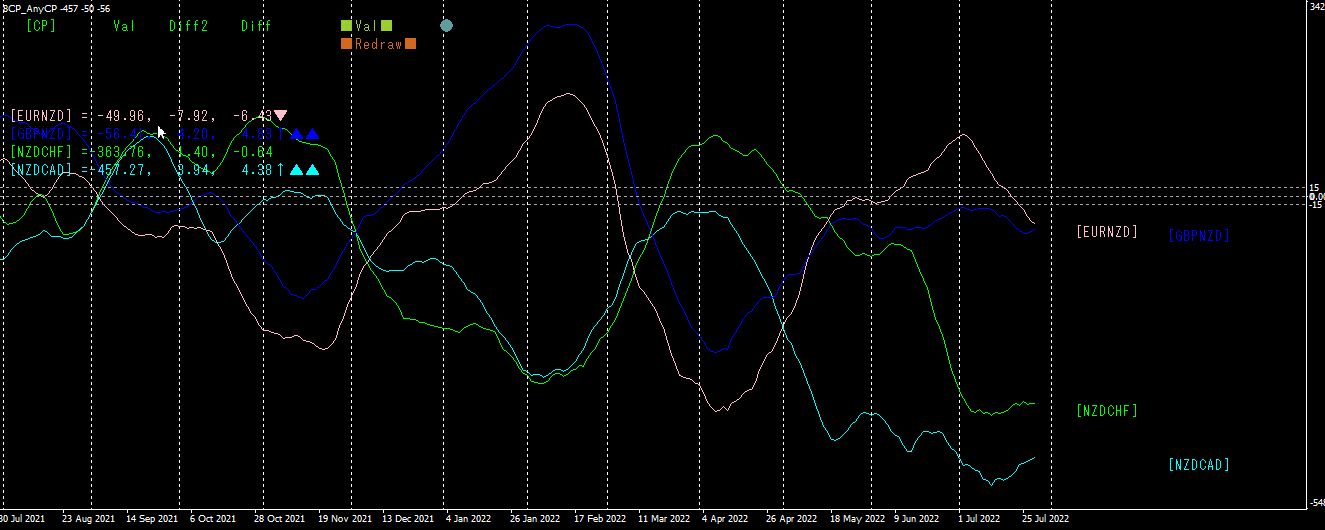
With this, the day-to-day relative positions of all 28 currency pairs have been quantified.
Next, simply pick by the magnitude of the values.
Valvalue: pick the top 2 currency pairs, then pick 2 more from the next smallest worth.
Pairs with the largest positive values
USDJPY +891.01
CADJPY +775.27
Pairs with the largest negative values
EURUSD -660.54
GBPUSD -655.51