The Way of Investment (Bonus Edition)
The Royal Road of Investing (Bonus Edition)
FXWith a Later-Coming Rock-Paper-Scissors?!
While watching the chart using a currency strength indicator, I wondered, “Could there be a way to do a late-coming rock-paper-scissors withFXJST?”
1. Case 1 (CAD)
On 2022 year7 month13 day23:00 () the Bank of Canada announced a policy rate hike of1%. An interest rate increase generally strengthens the respective currency relative to others.
The chart below is the 5-minute chart forCADJPY on the day of the policy-rate announcement.
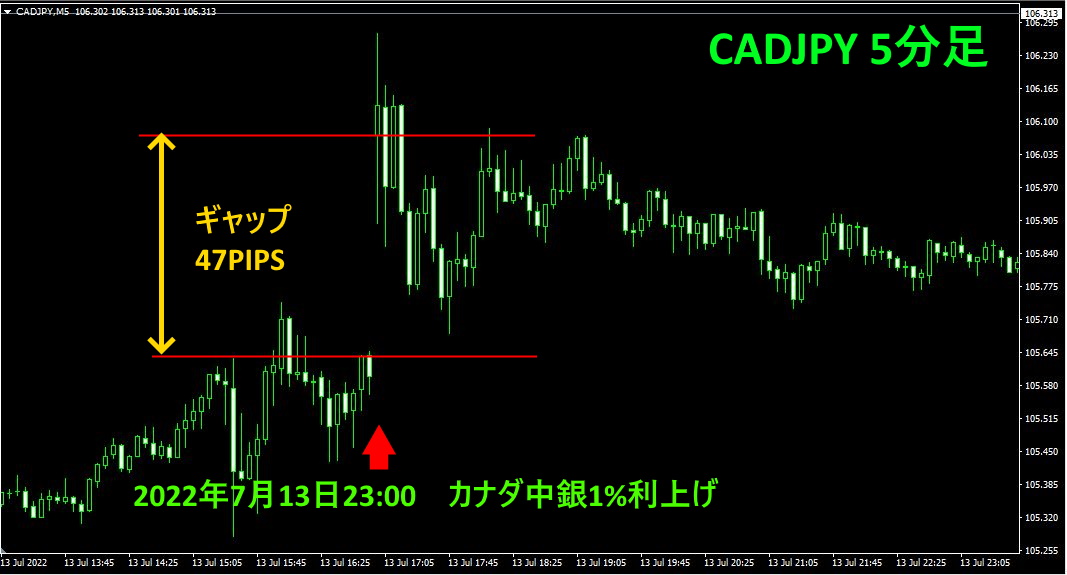
After the raise, it fluctuated wildly, and there was a gap (gap opening) of47PIPS on the chart.
Let us follow the subsequent movement.
Similarly,5-minute chart, but with the display range widened to the next day. Draw three horizontal lines.3 lines drawn.
①
Resistance line
②
Resistance line drawn on the basis of closing prices
③
Horizontal line at the opening-gap high
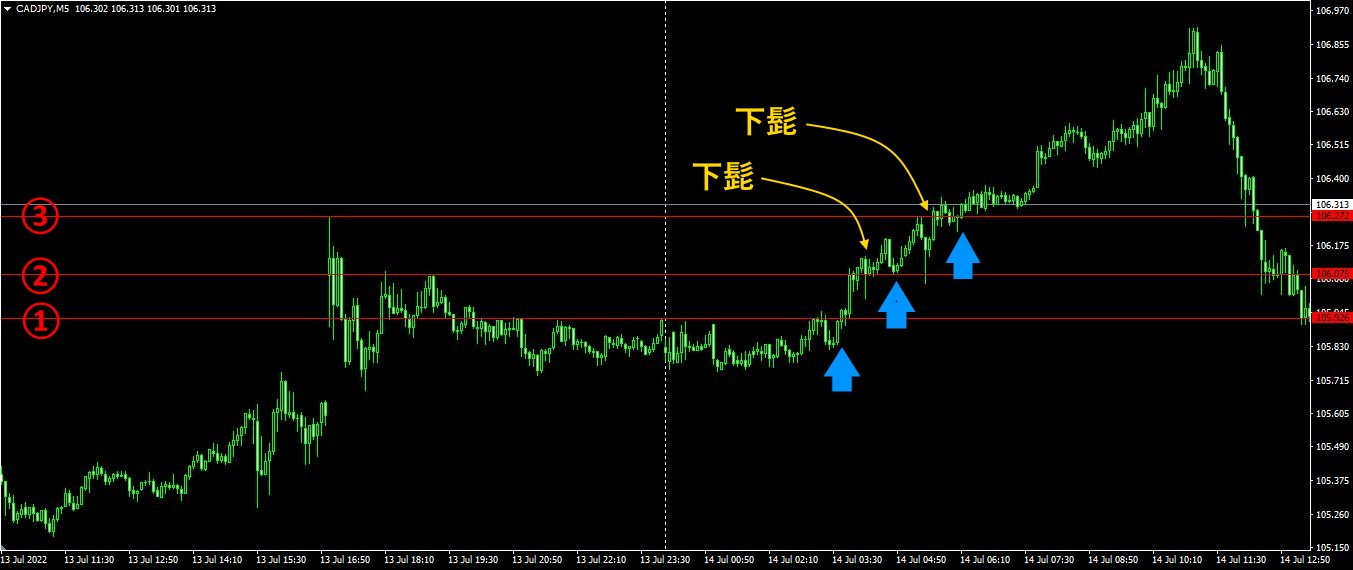
Since the rate hike announcement is known to push prices higher, we enter a buy trade where the lines ①, ②, and ③ are broken (light blue arrows). The chart pattern also shows long lower shadows at two places, indicating strong upside buying pressure.2where the long lower shadows appear.
Rate hike announcement→High volatility with gaps→Consolidation (about10 hours)→
Breaking above each resistance line→ Nth peak→Decline
When a currency’s rate increase is announced, monitor that currency (CAD) and the weakest currency on the daily chart (in this exampleJPY) currency pair CADJPY. Ignore the immediate wild moves after the announcement, and if it breaks above the resistance line the next day, enter a buy trade with the later-coming rock-paper-scissors principle.“Late-coming rock-paper-scissors” entry.NIf you can capture a reasonable profit, take profits; if the uptrend line is broken, take profits.
In this case, about50 to60PIPS of profit was captured via the“late-coming rock-paper-scissors” method.
As a precaution, let us also look at currency-strength graphs. The figure below shows the “8Currency Strength Visualization Indicator” displayed on the CADJPY15-minute chart.
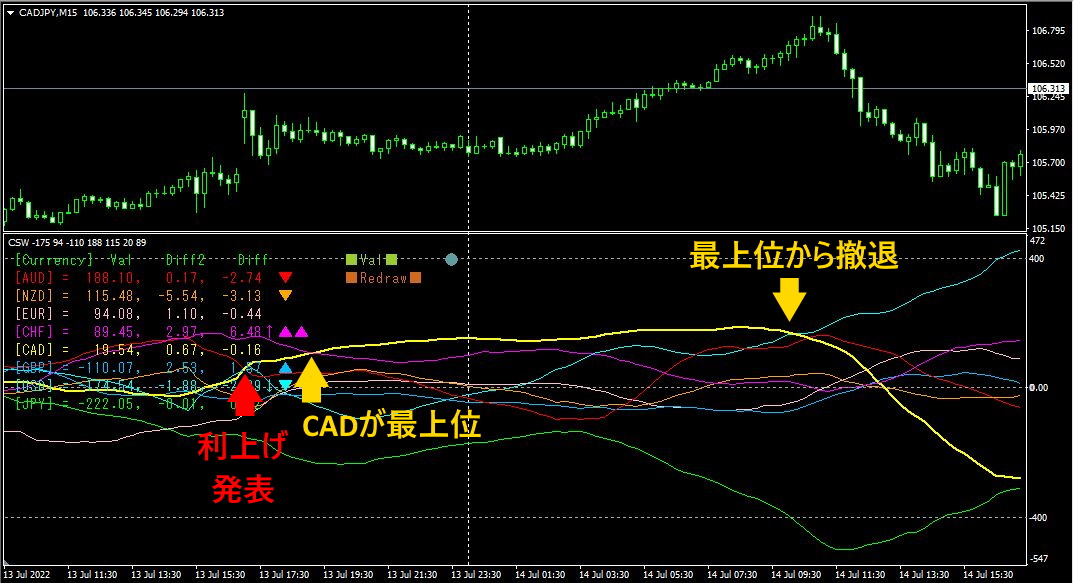
The upper half is theCADJPY 15-minute chart, and the lower half is the chart drawn with the8C currency strength visualization indicator. The yellow bold line represents the CAD graph. From just after the rate hike, CAD rose to be the strongest currency. The next day CAD ceded the top spot to USD and retreated. During this period, JPY (green graph) stayed at the bottom.
While CAD remains at the top, if you hold a CADJPY long position, you would have earned about70PIPS in profit.