The Way of Investment (Part 5)
The Path to Investment Mastery (Part5)
2022 Year2 MonthAUDJPY Buy trade in detail.
1.
Details of the daily-entry point
When entering a daily trade, the entry day and the direction are already determined by the indicators displayed on the daily chart. However, if possible, we would like to buy at as low a price as possible without getting caught at a high price during the day’s price movement.
Therefore, we will display a shorter time frame chart (15 minutes) and, by using oscillators and the like, consider buying at a cheaper price.
2.
2 Month10 Day Threshold Exceedance Entry
As oscillators,RSI and Stochastic have been introduced. The parameters are theMT4 default settings.
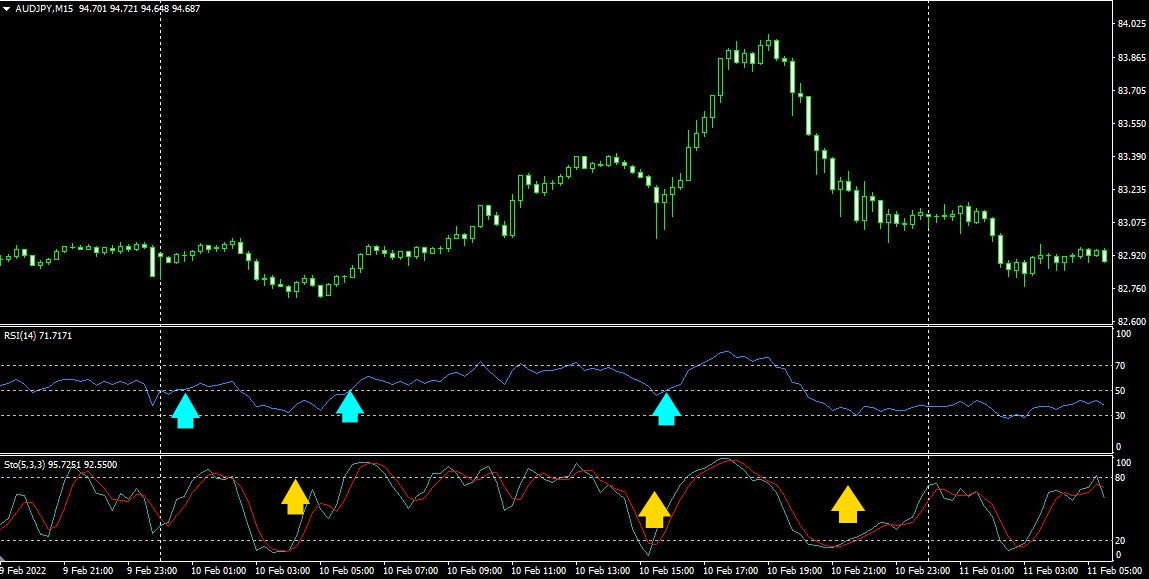
The light blue arrows indicate the point where theRSI crosses the 50 line from below to above.
The yellow arrows indicate the point where the main line of theStochastic crosses above the 20 line.
In both cases, you can enter a buy at a relatively low price within the day’s price movement.