The Way of Investment (Part 1)
Daily chart,4hour chart, etc. – I’ve recently come to think that long-term trading based on these timeframes might be the true path of investing.
Regarding trading on longer timeframes, I am considering what criteria to use to build a strategy, and fortunately, the “8CP Visualization Indicator” works well on daily and 4-hour or other long-term charts, and it actually yields better results on longer timeframes than on short-term timeframes.
The figure below is the daily chart of AUDJPY. The lower half shows the8CP Visualization Indicator for Oceania edition. The display period is from2021 year3 month to2022 year6 month.
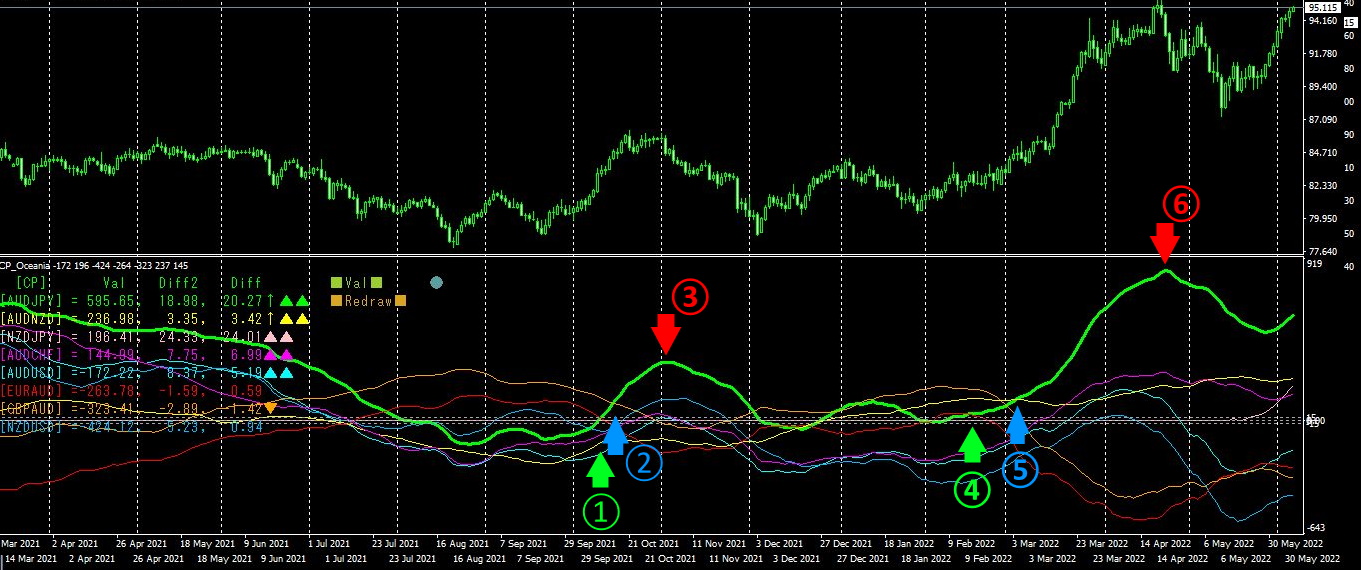
In 2021 year10 month and2022 year3 month, a buying entry opportunity occurs.
× ![]()