

Check market overheating at a 45-degree angle of the Gyan line!
Hello!
This is Satari, researching FX.
This time I will comment on Gann's 45-degree line.
William Gann was an American investor who lived from 1878 to 1955.
He developed his own analytical method and, by strictly following the rules, boasted an lifetime win rate of 80%.
He is a legendary trader who supposedly predicted the 1929 Great Depression one year in advance.
Gann believed that time and price were in balance, and he drew diagonals (45°), its half-angle (22.5°), and quarter-angle (11.25°) radiating on a square chart to analyze price movement patterns.
In practice, to accurately express the 45-degree line where time and price balance on MT4, you would need to fix the price range, which is quite laborious and makes it difficult to master.
So, I have created an indicator that automatically draws trendlines at angles aligned with Gann's 45-degree line.
http://livedoor.blogimg.jp/fxmt4indicator/imgs/c/d/cd9ca9f5.gif
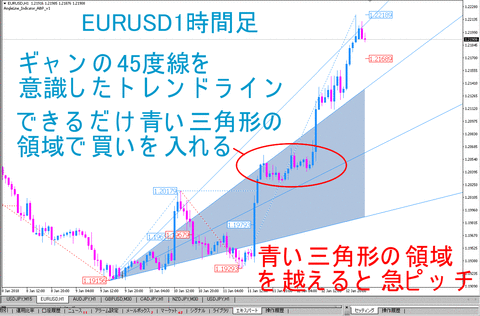
By buying in the blue triangular region, you can buy at a time when the market is not overheated.
For a buy, Gann's 45-degree line corresponds to the upper side of the blue triangle.
The figure below shows the USDJPY 1-hour chart with Gann's 45-degree line drawn during a downtrend.
http://livedoor.blogimg.jp/fxmt4indicator/imgs/b/5/b527e941.gif
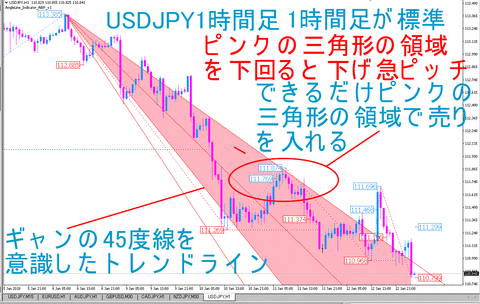
For selling, if you short within the pink triangle region, you can enter before the downward move accelerates.
In a downtrend, the bottom edge of the pink triangle corresponds to Gann's 45-degree line.
Up to here, it has been displayed on the 1-hour chart as is.
Please consider the 1-hour chart as standard.
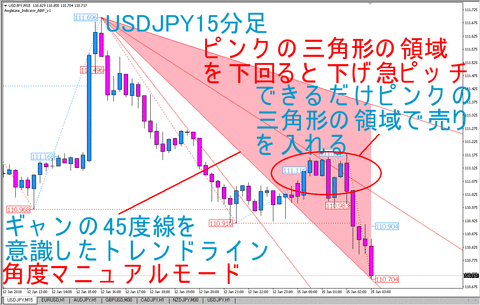
However, this indicator will not draw a trendline aligned with Gann's 45-degree line for an uptrend unless the uptrend criteria are met, and
it will not draw a trendline aligned with Gann's 45-degree line for a downtrend unless the downtrend criteria are met.
The figure below shows the USDJPY 15-minute chart with a downward trendline oriented to Gann's 45-degree line.
http://livedoor.blogimg.jp/fxmt4indicator/imgs/5/d/5d71af74.gif
Since it is not a 1-hour chart, the angle is set manually.
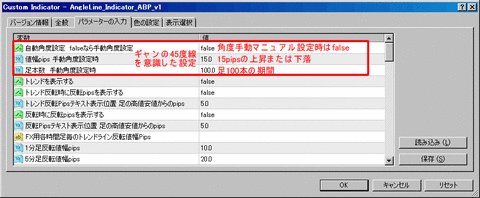
As shown in the red box below, the rise or fall over 100 bars is fixed at 15 pips.
http://livedoor.blogimg.jp/fxmt4indicator/imgs/b/2/b2a18b88-s.gif
For charts other than the 1-hour chart, please adjust manually and draw trendlines that reflect Gann's 45-degree line.
“Indicator that automatically draws trendlines aligned with Gann's 45-degree line”
http://fxmt4indicator.abproducts.biz/wp/?page_id=2459
By the way, there has been a change in the release plan until January 15, so we would like to inform you.
ADX DMI indicators and EA
have already been released.
The Bollinger Bands Reversal Signal Indicator and EA have been changed to ATR indicators and EA.
As for the indicator that automatically draws trendlines aligned with Gann's 45-degree line, as well as the EA,
the indicator has been released, but the EA is delayed.
The EA is expected to be released in 2–3 days, and we will post updates on the blog.
We apologize for the inconvenience and appreciate your understanding.
Thank you very much for reading this far today as well.
Then take care and be well.
Technical Trade Blog Rankings
<Seminar Information>
********************************************************************************
[February 11, 2018, 14:00]
********************************************************************************
In the above seminar, as a participant benefit, we will provide EA and indicators using EMA slope and crosses as teaching material, and give them to you as is!
///////////////////////////////////
Issuer: Art Brain Products
FX Technical Strategy Researcher
Satari Mind
Email: info@atmarkabproducts.biz
Blog: Fibonacci Retracement FX Research:
Indicators & Tools & EA:
///////////////////////////////////
If you wish to subscribe to the free newsletter “FX no Shirabe,” please use the URL below.
× ![]()


