

To all purchasers of 【Free Seven-Color Indicator】 and 【Paid Ajinitch Indicator】
Good morning everyone.
My name is Ku (Kū), a part-time trader.
Today, I will provide an explanation about the two indicators I sell on Gogojungle.
The contents are as follows.
Currently, free indicators
Indicator Nanashikiku (Nanashiki Kū) 39,800 yen is free for now ↓
https://www.gogojungle.co.jp/tools/indicators/24852
Password: Ajinitchi2022
Paid indicator + free EA
Indicator Ajiniッチ + supplementary tool EA【Indicator Ajinitch + EA】39,800 yen ↓
https://www.gogojungle.co.jp/tools/indicators/36476
And the campaign for the paid indicator Ajinitch + free Ajinitch EA ends this month.
From May, Ajinitch EA alone will be 39,800 yen.

From May, the total will be 39,800 yen for the paid Ajinitch indicator alone plus 39,800 yen for the paid Ajinitch EA alone, totaling 79,600 yen.
For those considering it, if you purchase the paid Ajinitch indicator alone for 39,800 yen by the end of April, the paid Ajinitch EA alone will be given as a free gift.
In other words, only now is half price.
Now, to the main topic.
The article's main update focuses on a follow-up video explanation for those who downloaded the “Nanashikiku” for free and those who purchased “Ajinitch” for 39,800 yen.
Please take a look at this first.
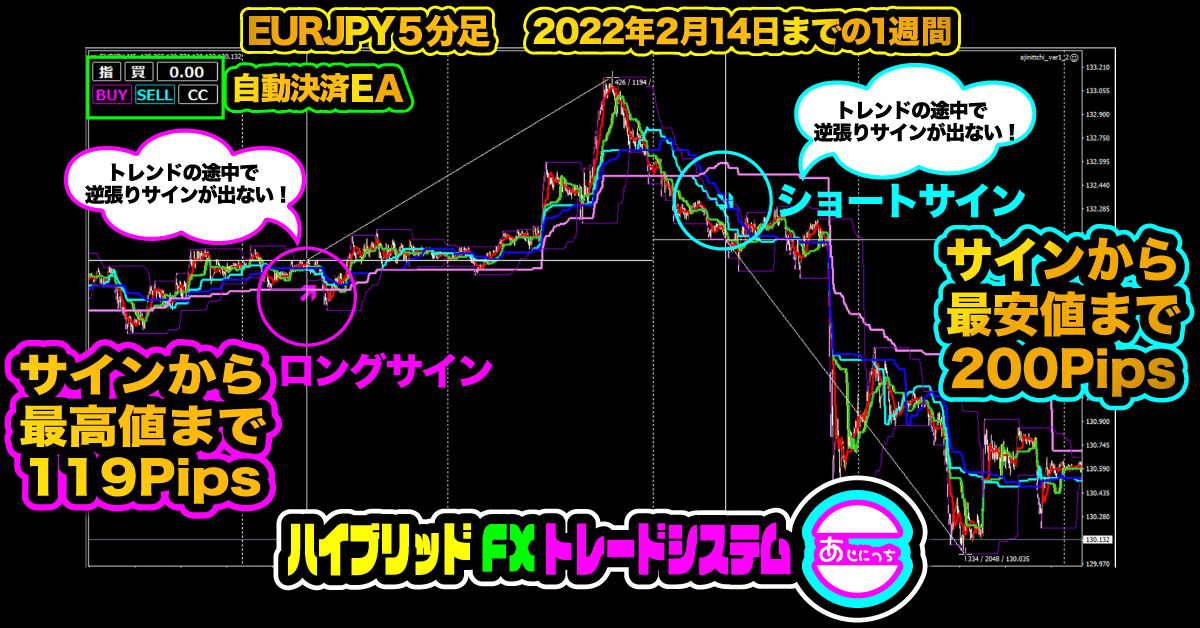
The video above explains the “Ajinitch method.”
I will explain the key points used in the video using still images.

Since I distributed it for free, I wanted you to earn, so I’ve provided a more detailed video explanation.
One major difference between indicators and automated trading EA is that with indicators, discretionary judgment equals the trading method.
I have about 15 years of experience in both, so I understand the features, advantages, and disadvantages of both to some extent.
After many years of such experience, I concluded that the combination of a indicator and semi-automatic EA is the strongest, and I am currently selling indicators as free and paid.

Now, I will explain the parameters of the free indicator Nanashikiku in order.

I will explain from the top.
Alternate signal true = a logic condition that the trend has reversed, producing a reversal signal.
Alternate signal false = continuous signals in the same direction are produced.
A disadvantage of consecutive signals is that long signals tend to occur frequently at the top, and short signals in a bottom area become frequent in a downward trend.These are among the points.Next, the second from the top.2nd signal true = shows only the second signal in a sequence to avoid easily misidentifying a trend reversal.2nd signal false = the signal will always appear when the conditions are met, making it easy to misread a trend reversal.As expected, the second signal has higher accuracy and reduces misrecognition of trend reversals.However, these two filters must be true for a truly powerful filter.There are scenes in the video showing what happens if you turn one of them off, so please refer to them.
These are among the points.
Next, the second from the top.
2nd signal true = shows only the second signal in a sequence to avoid easily misidentifying a trend reversal.
2nd signal false = the signal will always appear when the conditions are met, making it easy to misread a trend reversal.
As expected, the second signal has higher accuracy and reduces misrecognition of trend reversals.
However, these two filters must be true for a truly powerful filter.
There are scenes in the video showing what happens if you turn one of them off, so please refer to them.

With the default signal position, when you zoom out the candlesticks, the signal can look buried below the candles, so increasing the value in the red-framed area moves it a bit away from the candles.
In my case, I enter 222.
With larger numbers, the signal will be displayed even further away.
Next, regarding zooming out to minimize candles, minimizing makes you ignore the small price movements of the candlesticks entirely.
And by viewing the chart from a hawk’s-eye view, you can recognize a weekly period and imagine what the weekly shape looks like.
Last week was a strong bullish USD/JPY, but as I mentioned in the article two weeks ago about three bullish candles as a take-profit line, it is taking on a ceiling-like appearance.
If you didn’t recognize the weekly chart, you might have bought at the peak and faced a 300+ pip drop, forcing you to cut losses, right?
Since I predicted a ceiling the weekend before last, those looking for selling opportunities might have taken substantial profits quickly.

The uptrend is certainly continuing, but as I predicted two weeks ago in Investment Navigator+, a ceiling is also visible.
Here is the Investment Navigator+ article from the weekend before last.
With a pullback and then another rise, it will be interesting to see how far the pullback goes.
In any case, forecasts are inherently uncertain, so you should prioritize discretionary judgment on the 5-minute chart despite any fundamental information.
I also explained entries and exits for situations when you happened to be present when a signal confirmed.

In a downtrend, it is not certain how far a rebound will go, but I use the 4-hour 50% retracement as a reference point.
I mentioned using the 26-period base line and the 9-period conversion line from the Ichimoku Kinko Hyo on the 4-hour chart as a guideline for entering martingale trades.
For example, suppose you entered a position with an initial lot of 0.01, but the trend moved in the opposite direction of your expectation.
The stop loss is 50 pips, but if a blue long-term conversion line is touched 10 pips against you, you enter a 0.02 lot add-on with that touch as the basis.
If it then reverses, and the unrealized loss expands to where a long-term baseline line exists 30 pips from the initial entry, you add another 0.04 lots based on touching that long-term baseline.
Thus, total position becomes 0.01 + 0.02 + 0.04 = 0.07 lots.
And when price returns to the initial entry price, you close the position when your first position breaks even.
In my case, when martingale increases the position to a certain extent, I display total Pips on the chart with the EA, and when I reach more than 10 Pips in profit in total, I use a manual CC button to close all positions across the account.
If there is strong momentum above this high, I recommend stopping losses if entries are executed after triggering.
Ultimately, if the price rises above this level, performing a stop loss and taking a final stand with the long-term baseline line is an effective approach.
As an aside, the video recording became longer than expected, so I will note topics I didn’t get to cover.
Regarding risk management.
I advocate martingale, but martingale has a very important challenge.
In short, money management.
For example, with domestic brokers, leverage is 25x, so buying USD/JPY with 20,000 units using 100,000 yen in funds makes it more prone to capital shortfalls.
With a 100,000 yen margin limit for 20,000 units, 0.01 is the initial lot, and the next martingale is 0.02.
0.04–0.08 brings the total to 0.16.
That is the upper limit.
If a 1,000-unit lot on USD/JPY requires 4,000 yen margin, that is 16x, totaling 64,000 yen, leaving 36,000 yen.
If you don’t stop around here, the damage from stop losses will be severe.
If martingale adds 0.01 + 0.02 + 0.04 + 0.08 = total lots of 0.16 and a 50-pip stop loss, that is a loss of 8,000 yen on 16,000 units (50%),
Account balance 100,000 yen − 8,000 yen = 92,000 yen, so you can still trade.
If you limit daily loss to 10% of balance, you can calculate martingale levels and initial lot size.
If you have 1,000,000 yen, you can hold ten times that amount in lots, so initial lot would start at 0.1.
Conversely, with 100,000 yen or less, the minimum lot may be below 0.01.
This kind of money management is based on stop losses and limits daily loss tolerance.
A daily loss limit of 10% is my own view, and of course, those with less should aim even lower.
Below are the author I admire.
The above author discusses money management and various perspectives from professional traders in their works.
Risk management is a matter of discretionary judgment, but some books describe 2–5% as a range.
In short, the smaller your acceptable risk, the safer you are.
With that understanding of risk management, I would be glad if you could evaluate the “Ajinitch method.”
The video does not cover money management or risk tolerance, so I have shared my current thoughts here.
And following Vol.11, the next video is Vol.12.
That brings us to today's article.
Please watch the video for Vol.12 as well.
See you again!
This was Ku, a part-time trader.