
To purchasers of the indicator "Nanashikukū" (Nananashiikyū) and "Ajinitchi"
Good morning everyone.
My name is Ku (Ku), a part-time trader.
Today, for Gogojungle's interview project, we distributed a limited-time free indicator worth 39,800 yen.
Many of you may have already installed and are monitoring the Seven-Colored Sky indicator.
Regarding Seven-Colored Sky, there were a few questions, so I will write a manual for the Seven-Colored Sky indicator.
We received questions like the following.
“The default parameter for Seven-Colored Sky is the 1-minute chart, but which timeframe is best?”
In short, the answer is the 5-minute chart.
This is based on two years of forward-test results since Seven-Colored Sky was developed, so it is reliable.
For Seven-Colored Sky, you can use it with any timeframe and any chart parameters, but for the new product “Ajinitchi,” we designed it to function only on the 5-minute chart.
From this difference, it’s clear that my logic does not align with other timeframes.
At the initial development, I experimented a lot with optimal timeframes and parameter combinations, which made the parameters somewhat complex.
Of course, traders vary, so it’s not universally correct to say only the 5-minute chart works, but as a personal opinion for Seven-Colored Sky, I would prefer displaying a 5-minute chart if possible.
Regarding “Ajinitchi,” if you don’t display the chart at 5 minutes, signals do not appear on other timeframes.
Some of you may have both, but using two indicators simultaneously is not very meaningful, so if possible please prioritize “Ajinitchi.”
As for the manual of “Seven-Colored Sky,” while “Ajinitchi” cannot change numerical parameters, “Seven-Colored Sky” was a product in development, so its parameters are quite complex.
Since the indicator logic is exposed, traders can create many possible combinations by themselves.
With Seven-Colored Sky, beware that having many combinations can be a disadvantage.
Now, I’ll explain using images.
First, about the parameters of Seven-Colored Sky.
The recommended parameters follow patterns like this.
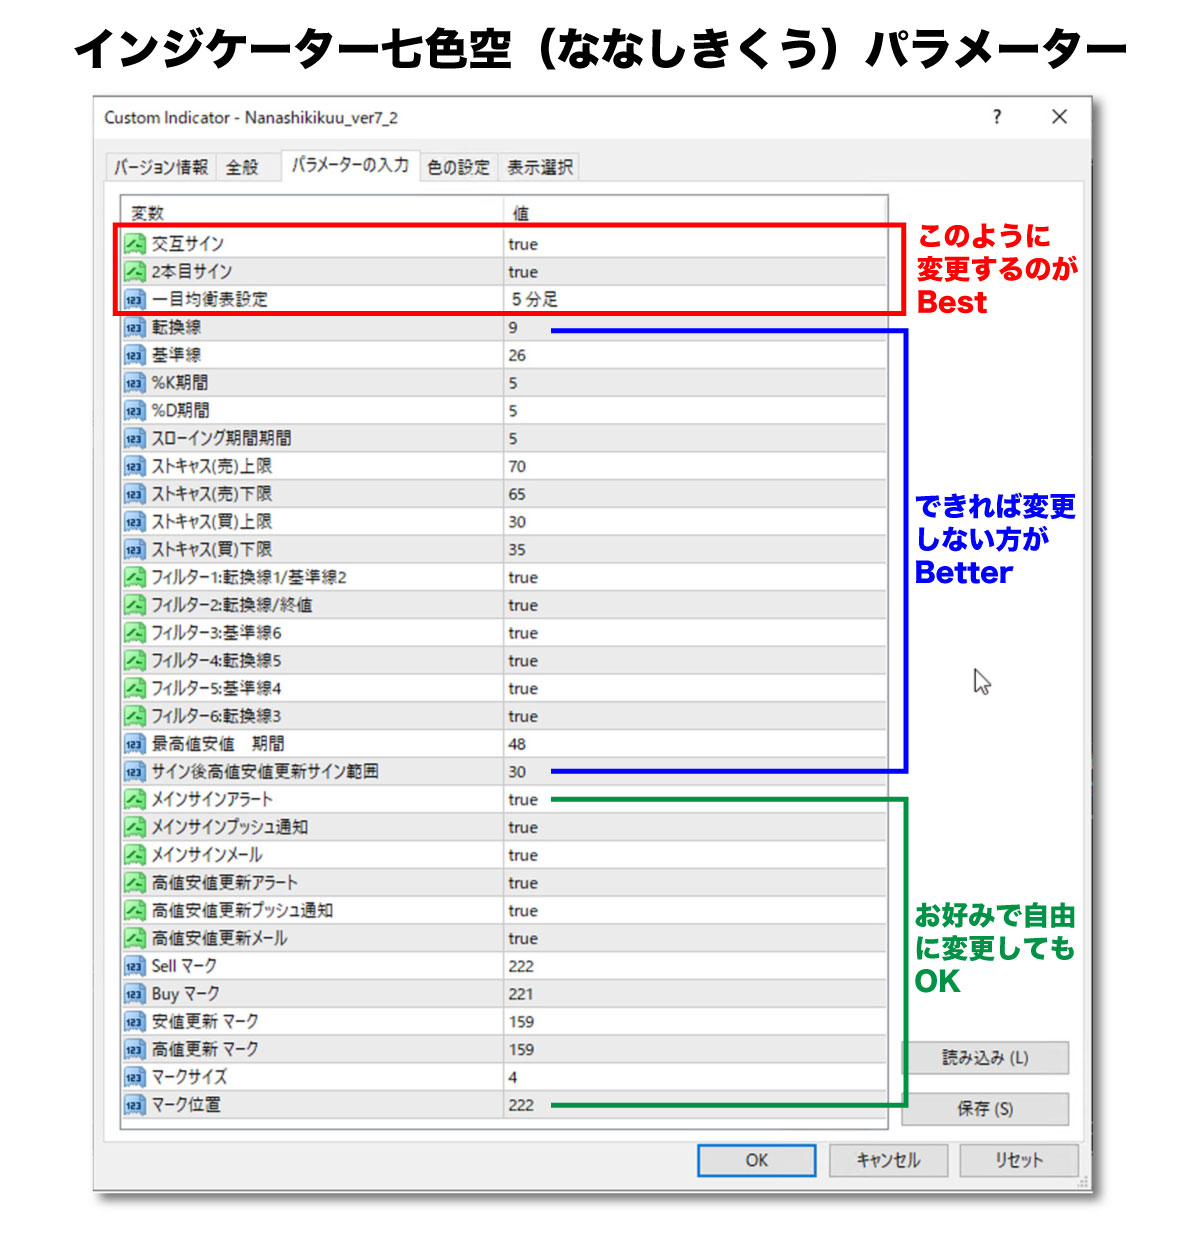
The parts in red at the top are the parts you should ideally change.
Regardless of the default state, this is the setting with the highest signal accuracy.
Even so, false signals are not zero, so the discretionary rule uses mainly correlation and inverse correlation, the diffusion of six lines, and whether the price is fluctuating up and down around the lines as guidelines.
This setting has the fewest signals, so it may feel unsatisfying.
In the latest USD/JPY 5-minute chart, it looks like this. (Note: timing of signals may vary by broker.)
Setting Seven-Colored Sky with these parameters looks like this. ↓
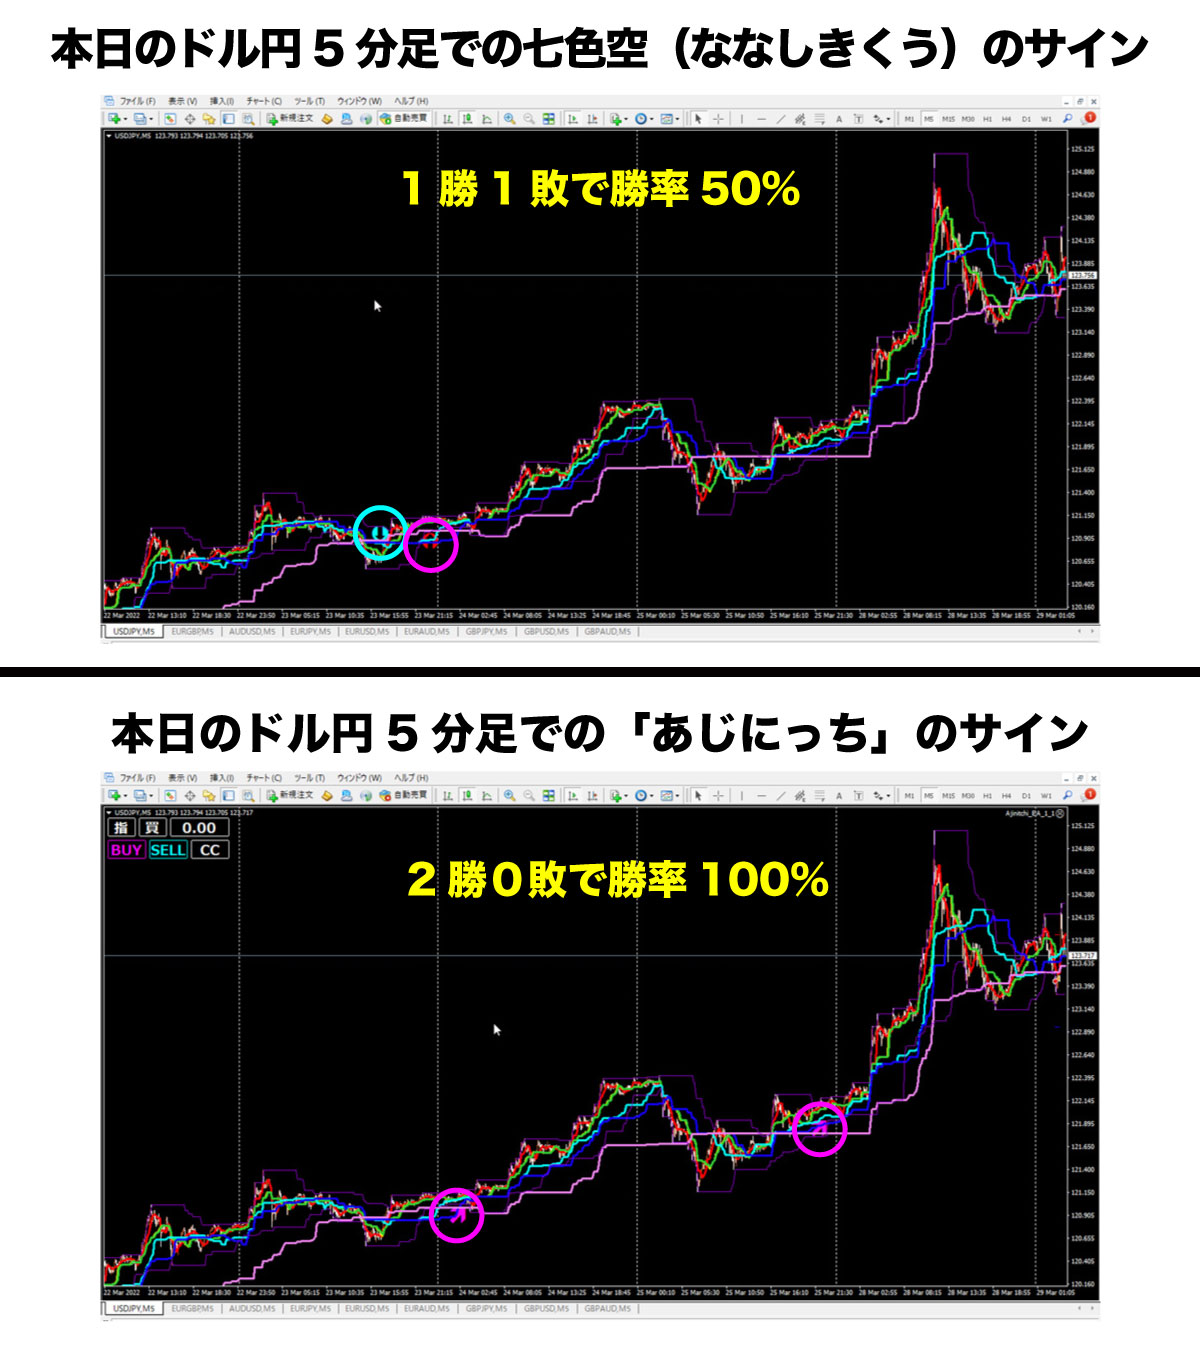
It’s getting quite close to [Ajinitchi], isn’t it?
Even so, compared to [Ajinitchi], the accuracy is lower, but in Seven-Colored Sky there is one false signal and one winning signal.
For Seven-Colored Sky, the risk-reward with a 1:1 ratio and a 50-pip stop and 50-pip take would be breakeven, but with a 1:2 risk-reward, for example a 25-pip stop and a 50-pip take would leave a profit.
Ajinitchi is fine.
※That doesn’t mean Ajinitchi has no false signals, so please make final judgments by discretion using correlation, inverse correlation, and chart aesthetics.
Now, I’ll explain about stop-loss orders.
My trading logic is based on Dow Theory.
About Dow Theory, you can look it up, but here I’ll explain using the USD/JPY 5-minute chart.
In Dow Theory, if the most recent high is rising and the most recent low is rising, one cycle; if this pattern continues, two cycles, making trends easier to continue.
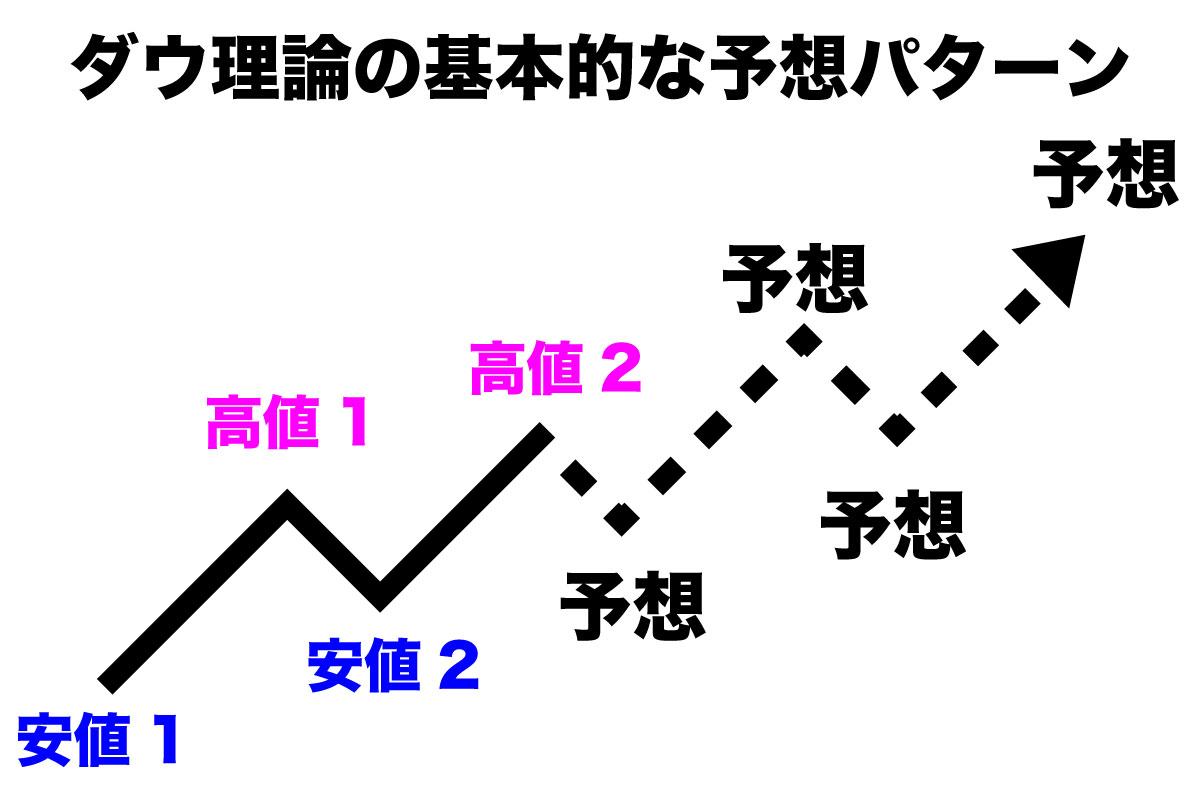
As shown above, if the recent low and high are consecutively rising, a long trend is believed to continue.
What you see here is the Dow Theory turned into an indicator called the High-Low Line.
The High-Low Line is the thin purple line that runs above and below the price bars, positioned to sandwich the price candles.
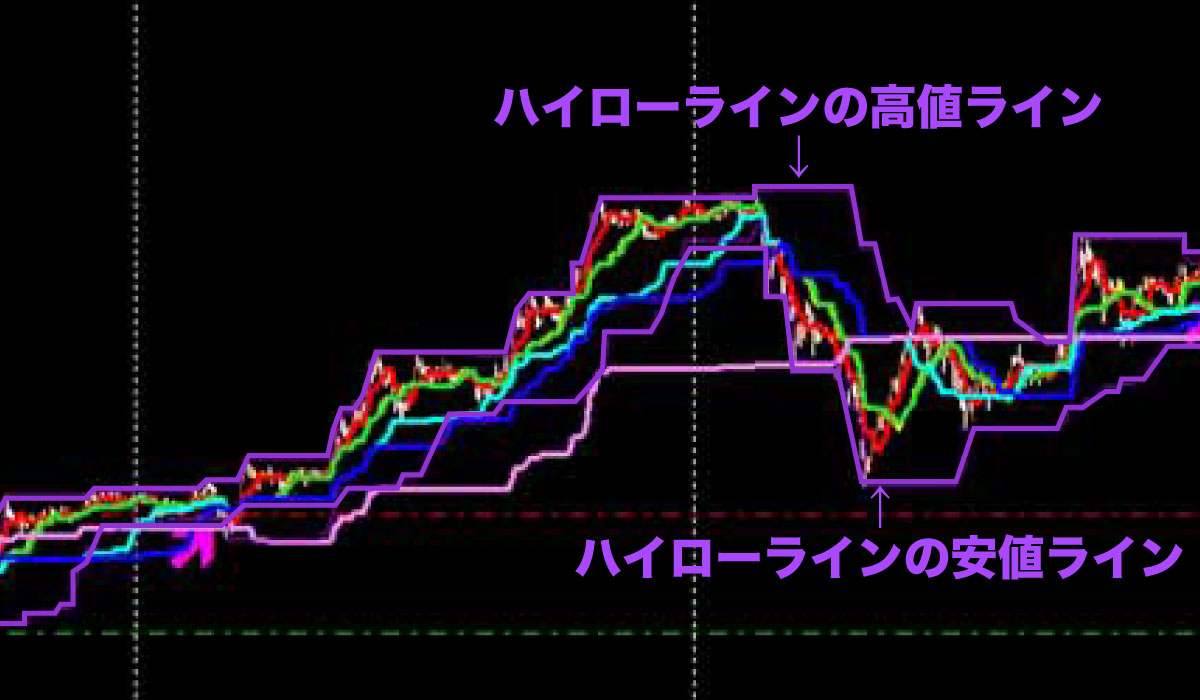
The lines above and below the candles in the figure are the High-Low Line.
They’re thin and hard to see, so I traced them in Illustrator to make them thicker.
In actual screens, they may still be a bit hard to spot, but they’re important lines.
Whether the most recent high is updated or the most recent low is updated is one criterion, so the idea is to place a stop order in reverse when appropriate.
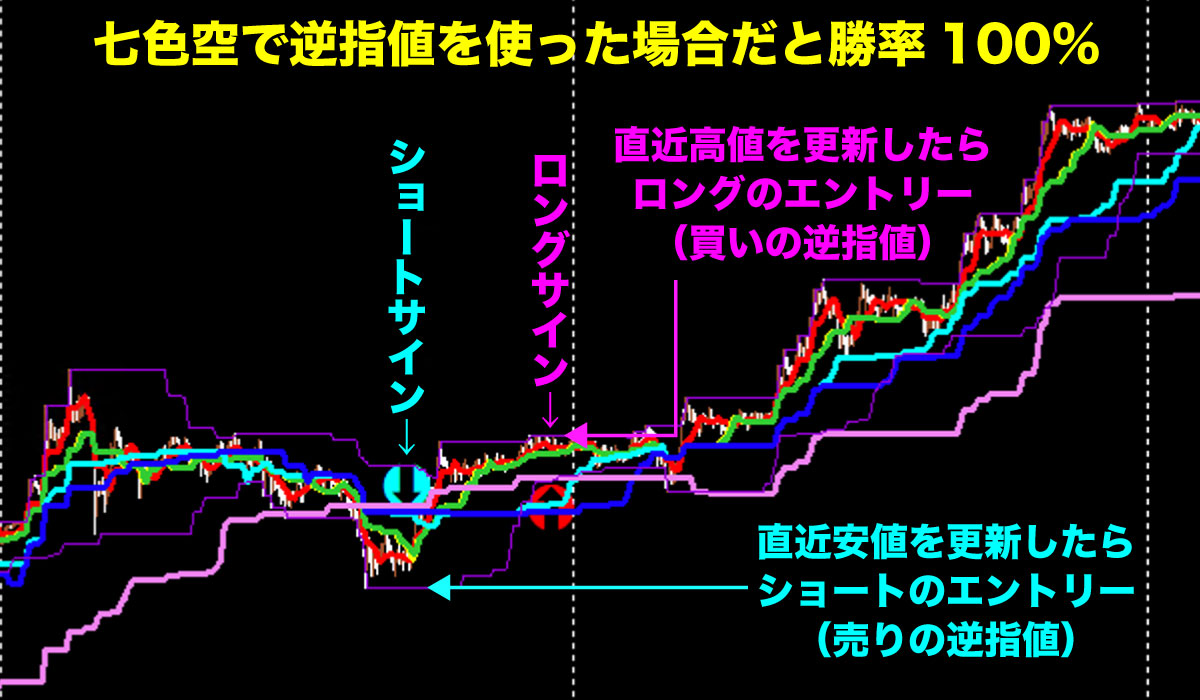
Back to the topic: in Seven-Colored Sky, win rate was around 50%, but if you have a habit of using stop-loss orders, the win rate becomes 100%.
When the Dow Theory is used as a method, you basically use stop-loss orders.
Please look at the figure below.
Today’s USD/JPY 5-minute chart.
The same Seven-Colored Sky false signal as before, but if you see this sign and set a stop to update the most recent low, a short entry will not be executed.
The method of triggering is that the thin purple lines are the High-Low Indicator, so place a stop 2 Pips below from this value.
For the opposite long, place the reverse stop 2 Pips above the High-Low Line on the pink L-shaped arrow.
The short would rise without updating the low, so the entry would not be filled.
So you’ve avoided a false signal.
For a long, the price will update the high, so the entry becomes valid and you hold the position.
By the way, this High-Low indicator uses a period of 48 bars.
For a 5-minute chart, 48 bars correspond to 240 minutes, which is a 4-hour high/low.
If the four-hour high is updated, the upper value of the thin purple line is updated.
If the low is not updated, the lows gradually rise over time.
Use this as a guide to practice using stops in a demo account.
Seven-Colored Sky’s process to place stop orders is complex, but I hope you’ll learn it during this opportunity.
If a signal appears, repeatedly placing stop orders will help form a good habit.
Since this is practice, please be sure to use a demo account.
Now I’ll describe the steps to place a stop order with Seven-Colored Sky in order.
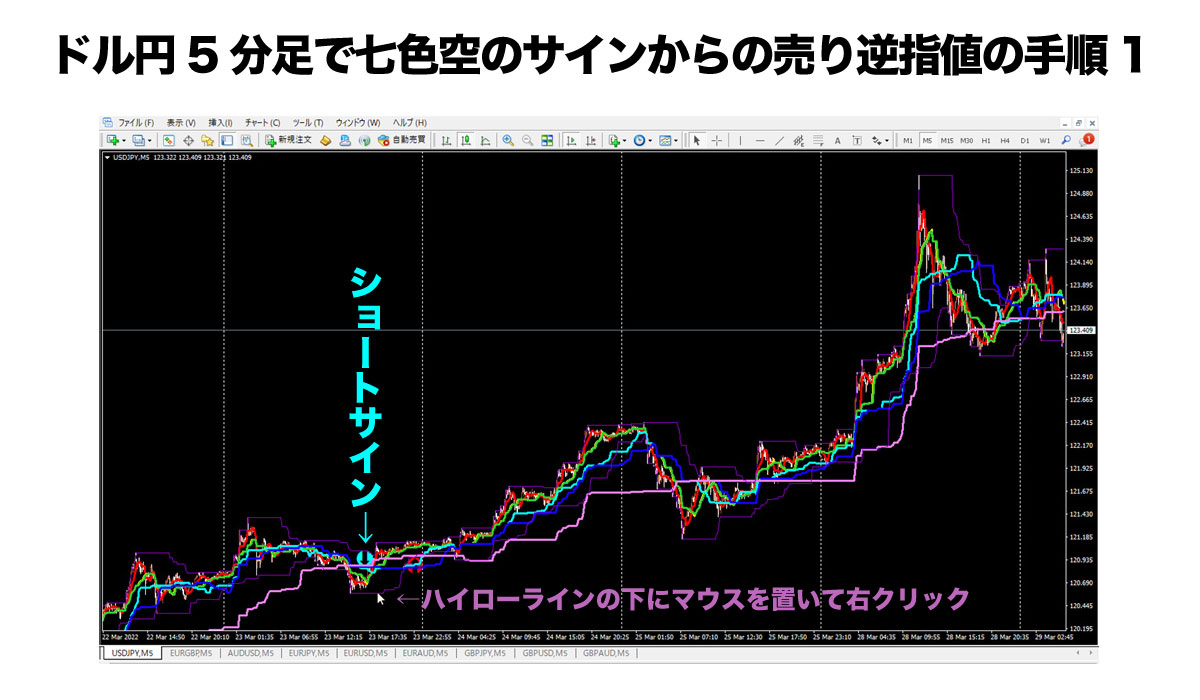
Now, there is a blue-green downward arrow signal on Seven-Colored Sky.
After a while, it’s okay to place a short stop order, so place the mouse just below the High-Low Line and right-click.
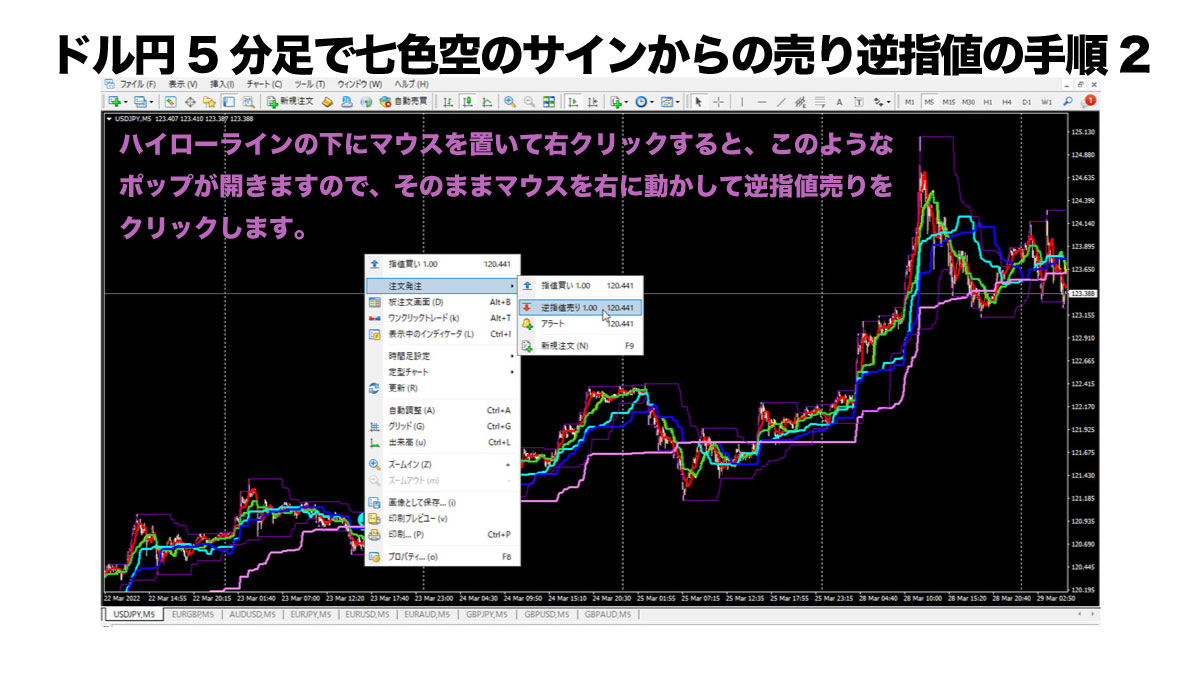
If you choose Sell Stop, a green horizontal wave line will be drawn where your mouse is.
Here the lot size is 1 lot and the price is shown, but other prices can be approximate; you’ll be able to fine-tune later, so place the Sell Stop for now.
After placing, the screen becomes like this.
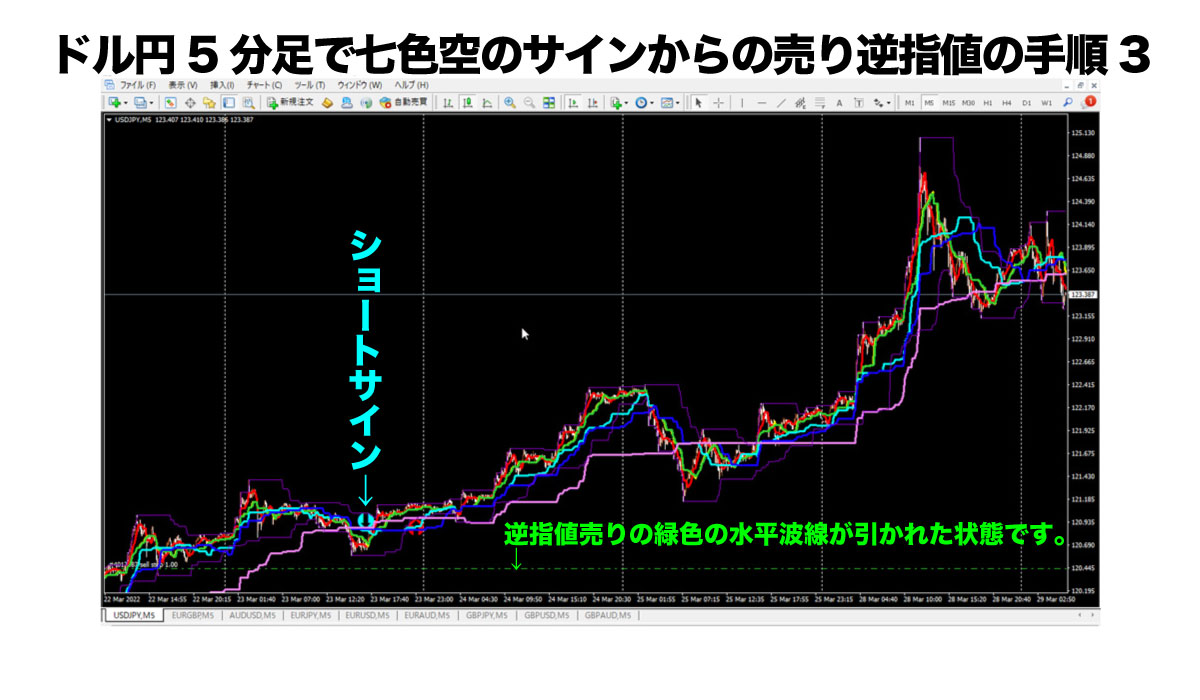
This roughly places the Sell Stop.
At this point, the entry would not have its stop-loss, take-profit, or trailing stop functioning, so you must manually adjust further.
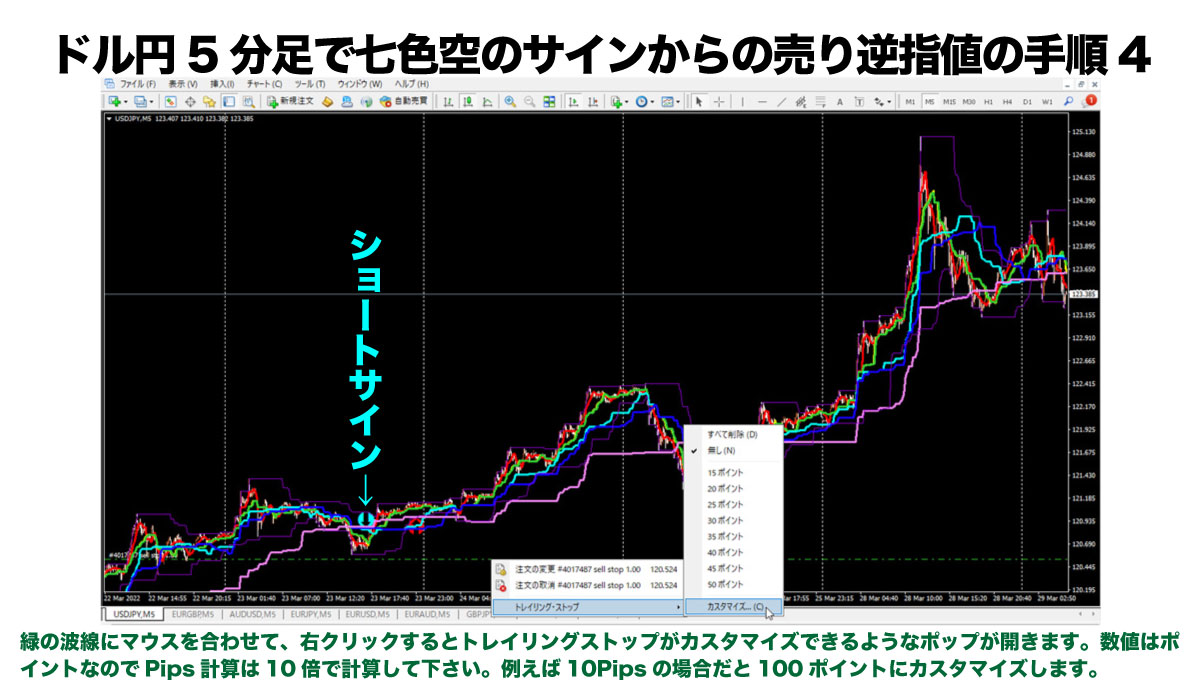
Thus, move the mouse over the green wave line of the placed stop and first enable the trailing stop.
After this, moving the stop position up or down will trail from the entry point, so set the trail first.
Next, enter the values for stop loss and take profit; you could just set stop loss, or take profit alone could be set.
I call the three tools the three sacred treasures: stop loss, take profit, and trailing stop. You place limit orders or stop orders, and whether the entry executes or not, you must set these three.
That’s how important these three settings are.
To make it easy, I developed the Ajinitchi EA to activate the three sacred treasures with one click.
For those who used the free Seven-Colored Sky indicator, Ajinitchi EA will be sold at a 30% discount from 39,800 yen as a standalone product.
In line trading with limit and stop orders requires a lot of manual work like this.
The existence of Ajinitchi EA, which performs all of this automatically with one click, is significant, and you should use Ajinitchi EA to automate everything except entry, to prevent forgetting to set stops or trailing stops.
Now back to the main topic: after a signal is confirmed, I’ll explain about stop orders.
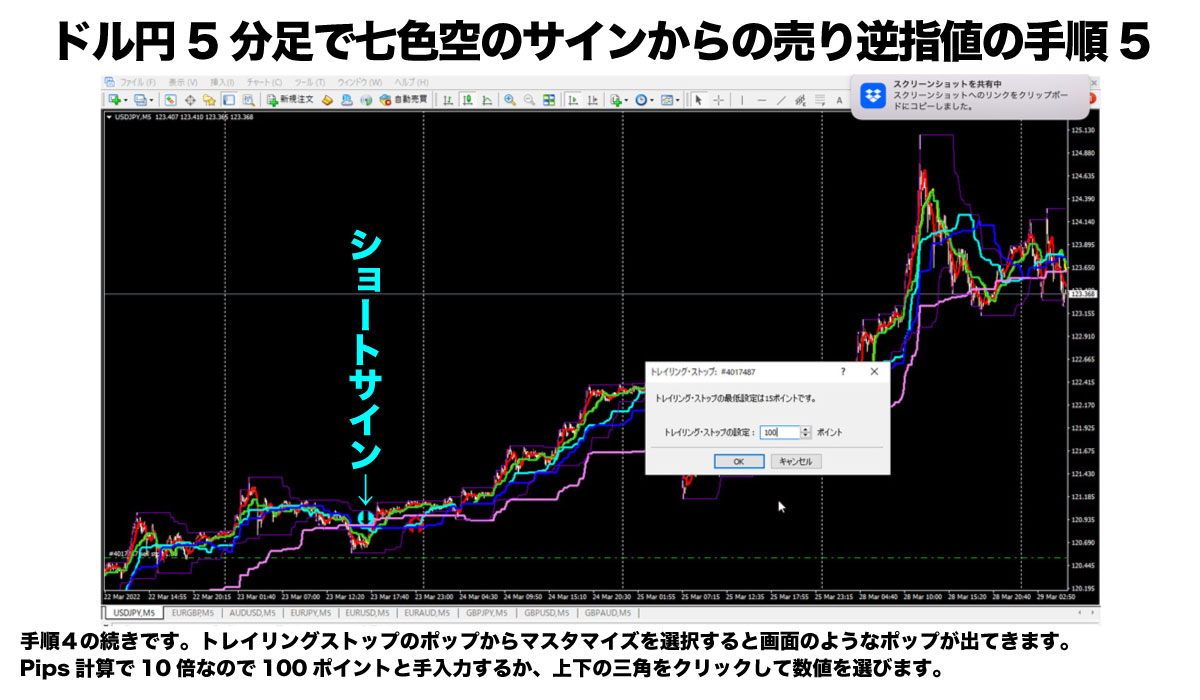
Choosing 100 points starts a 10-pip trailing.
The price shifts to lock in profit by 10 pips away from the price.
With this setting, even if the take-profit target is 50 pips, if the price rose to 49 pips in profit and then dropped to stop at 50 pips, that would be bad, right?
That’s where the trailing comes in.
If there is, say, 49 pips in profit, a stop automatically moves to 10 pips below the highest price, so you can lock in 39 pips of profit as realized.
Isn’t that sufficient? A single trade with 39 pips take would be great.
Of course, there are also unfavorable scenarios.
For example, you take 10 pips of profit, the trailing moves back to the entry price, goes against you, and ends roughly breakeven with a loss.
There are cases where a 10-pip rise is followed by a significant drop again.
The trailing width is tricky; I usually set it around 10 pips.
With bonds or other circumstances, 15 pips, or in major moves like this USD/JPY, 30 pips may be appropriate.
Now, onto the continuation.
This part is the most complex, but with repeated, persistent training, it becomes a straightforward task.
Even for me, the downside is the number of steps involved.
If you find it tedious, please look forward to the upcoming standalone release of Ajinitchi EA at the Seven-Colored Sky member price!
Just a little more and you’ll finish placing the entry for the stop order, so please keep up.
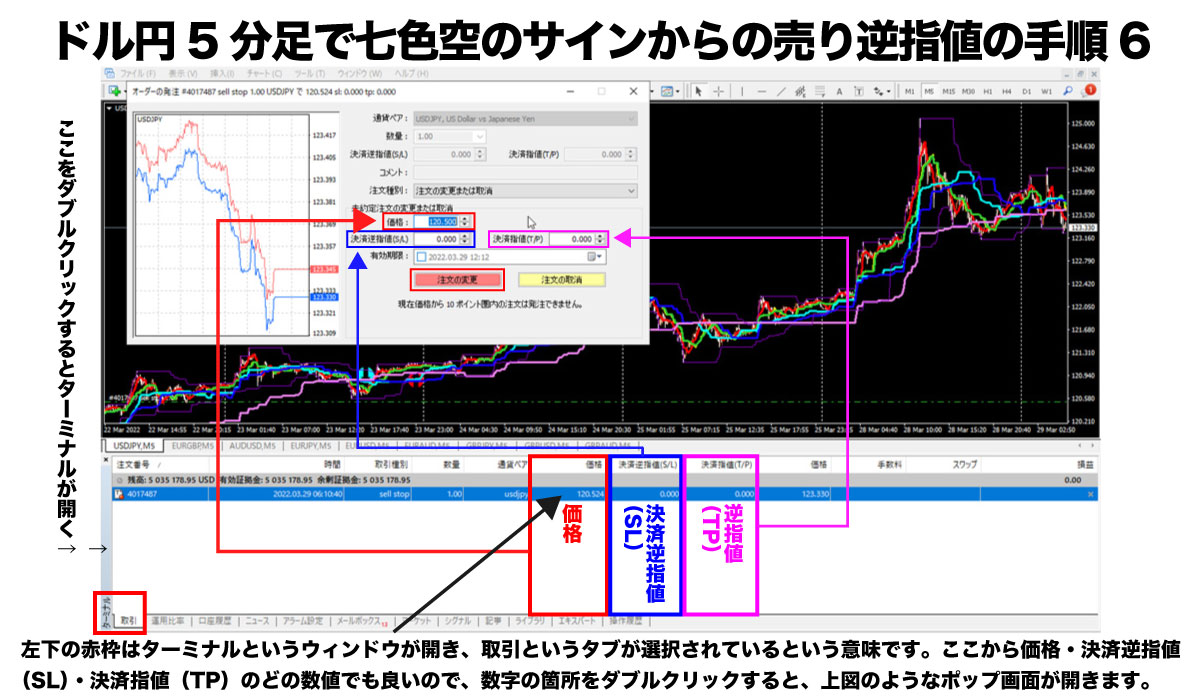
Here, first open the terminal window and start from the Trading tab.
In the Trading tab you’ll see that the entry has not been executed yet.
Profit/loss is 0.
This means the reverse stop order has not yet been filled.
With that condition, proceed to the next steps.
First, double-click the values for price, settlement reverse stop (SL), and stop (TP).
A pop-up opens as shown, and you input the three numbers above by typing or pasting.
Here, for clarity, I entered the reverse stop sale price as a round number. 120.500.
This sets a stop loss at 121.000 and take profit at 120.000.
Lastly, click the Change Order button to finish.
This screen shows the six steps completed.
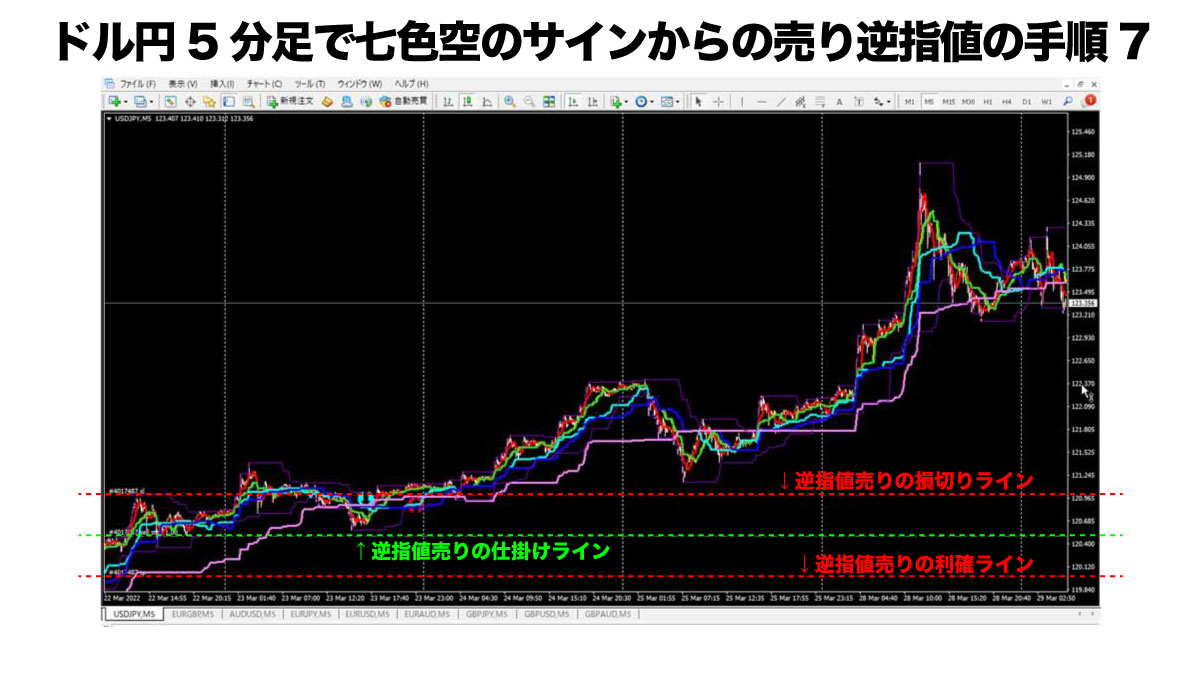
If you’re using the free Seven-Colored Sky indicator, the steps are: signal confirmed → discretionary judgment → place Sell Stop → trailing stop → enter stop loss value → enter take-profit value → confirm.
Let’s verify the above steps if you use Ajinitchi EA instead.
Initially, when a signal appears, you judge by discretion whether it’s a false signal, and this is the same for Ajinitchi and Seven-Colored Sky.
In cases like this, Ajinitchi may not emit a signal, but I’ll explain using a Seven-Colored Sky user who uses Ajinitchi EA.
If Seven-Colored Sky shows a short signal and you place a sell stop, here I’ll attempt placing it with Ajinitchi EA.
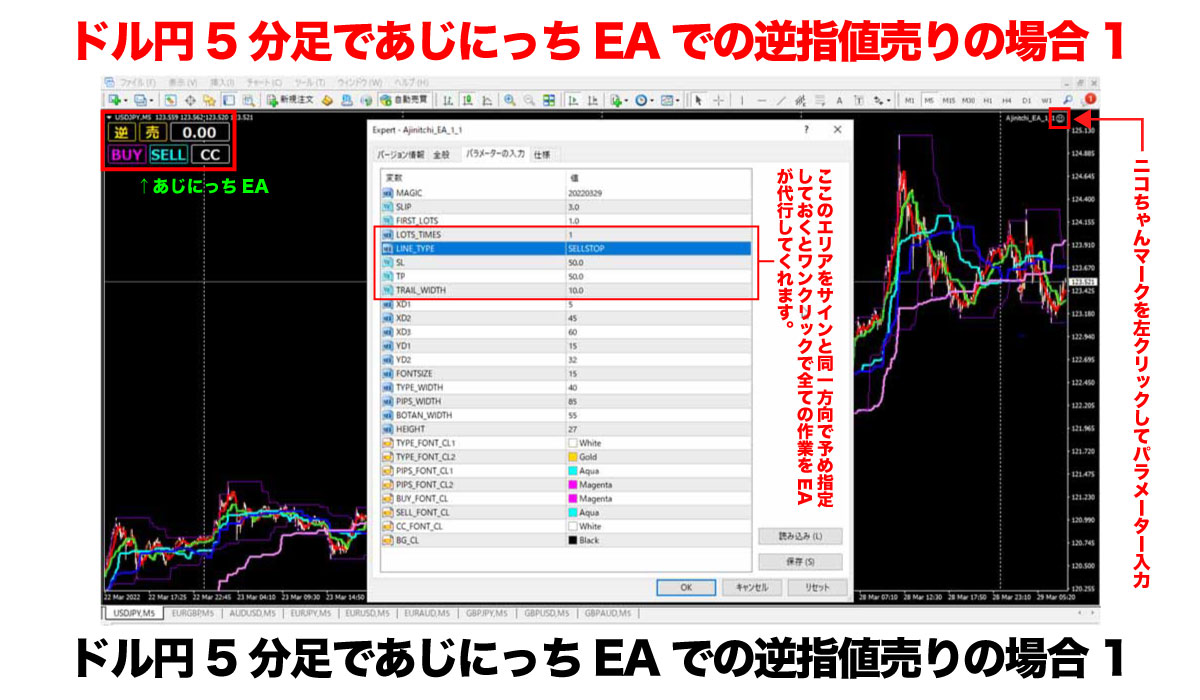
Set the EA parameters for the signal.
Process 1 is unnecessary if it’s pre-set.
You can also confirm in the main chart that the parameter for Ajinitchi’s reverse stop sale is being used.
If this setting aligns with your trend, then in the main chart you verify whether the limit order or reverse stop matches.
Lot size and trailing stop width are often pre-set, so you don’t need to do anything.
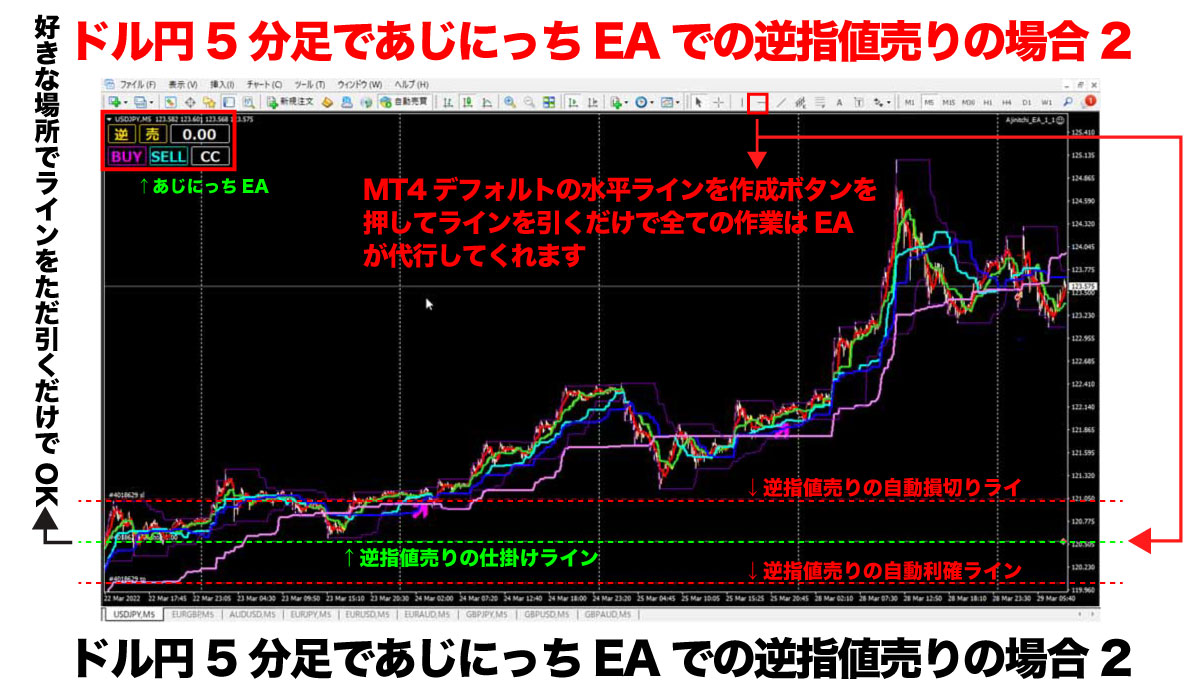
Using Ajinitchi EA eliminates all the tedious tasks, boosting workflow speed by 10x!
By clicking the horizontal line, the reverse stop sale set by the EA parameters is placed automatically.
Simultaneously, the three sacred treasures—stop loss, take profit, and trailing stop—are executed automatically.
Once an entry is made, these three treasures are executed, but if no entry occurs, this reverse stop sale remains as a pending order and may be canceled if the trend moves against you.
To cancel, click the EA button CC for mass settlement to cancel all positions, stops, and limits in the account.
How about that?
With Ajinitchi EA, Seven-Colored Sky users can reduce such complex tasks and execute with one click.
To reduce these complex tasks and enjoy a comfortable trading life, Ajinitchi EA is necessary.
Well then, that’s all for today!
I’ll lecture again, so please study carefully.
This has been Ku, the part-time trader!