
[Hybrid FX Trade System Ajinitch] Buyers and those considering purchase
Good evening, everyone.
My name is Ku (Kuu), a part-time trader.
In the past two days, there have been purchasers of the Hybrid FX Trade System Ajinitchi, so from now on I will write paid content for buyers during the first month free of charge, and also articles for those considering purchasing Ajinitchi in the future.
I hope to publish free articles for one month after registration that mainly help buyers improve their trading accuracy.
From the second month, I plan to provide more detailed video explanations as a paid content for 2,980 yen per month.
I believe the one-month free articles offer enough information, so buyers in particular should aim to master the methods during the free period as much as possible.
If you lack confidence, from the second month onward you can continue at 2,980 yen per month until you gain confidence.
I will write at least one article during the free month, and by watching the previous free articles and free videos repeatedly, I am confident you can learn a great deal.
The most important thing is that no indicator has a 100% win rate, so the issue is how you learn to avoid traps as described below.
It is not 100%, but if you doubt all signals you cannot enter, and if you enter on every signal you will incur more stop losses.
So, I believe the purpose of this article is to discuss what to convert into greater confidence.
Please refer to articles on correlation and inverse correlation as well and use them as study material.
As a part-time trader, I trade only in the gaps in my busy schedule, so I deeply understand the time constraints of other part-time traders as well.
Even in such circumstances, let's aim to earn 1,000 pips per month together!
Now, I will get to the main topic which has become quite lengthy.
First, I will talk about the scene where buyers start MT4 charts for the first time.
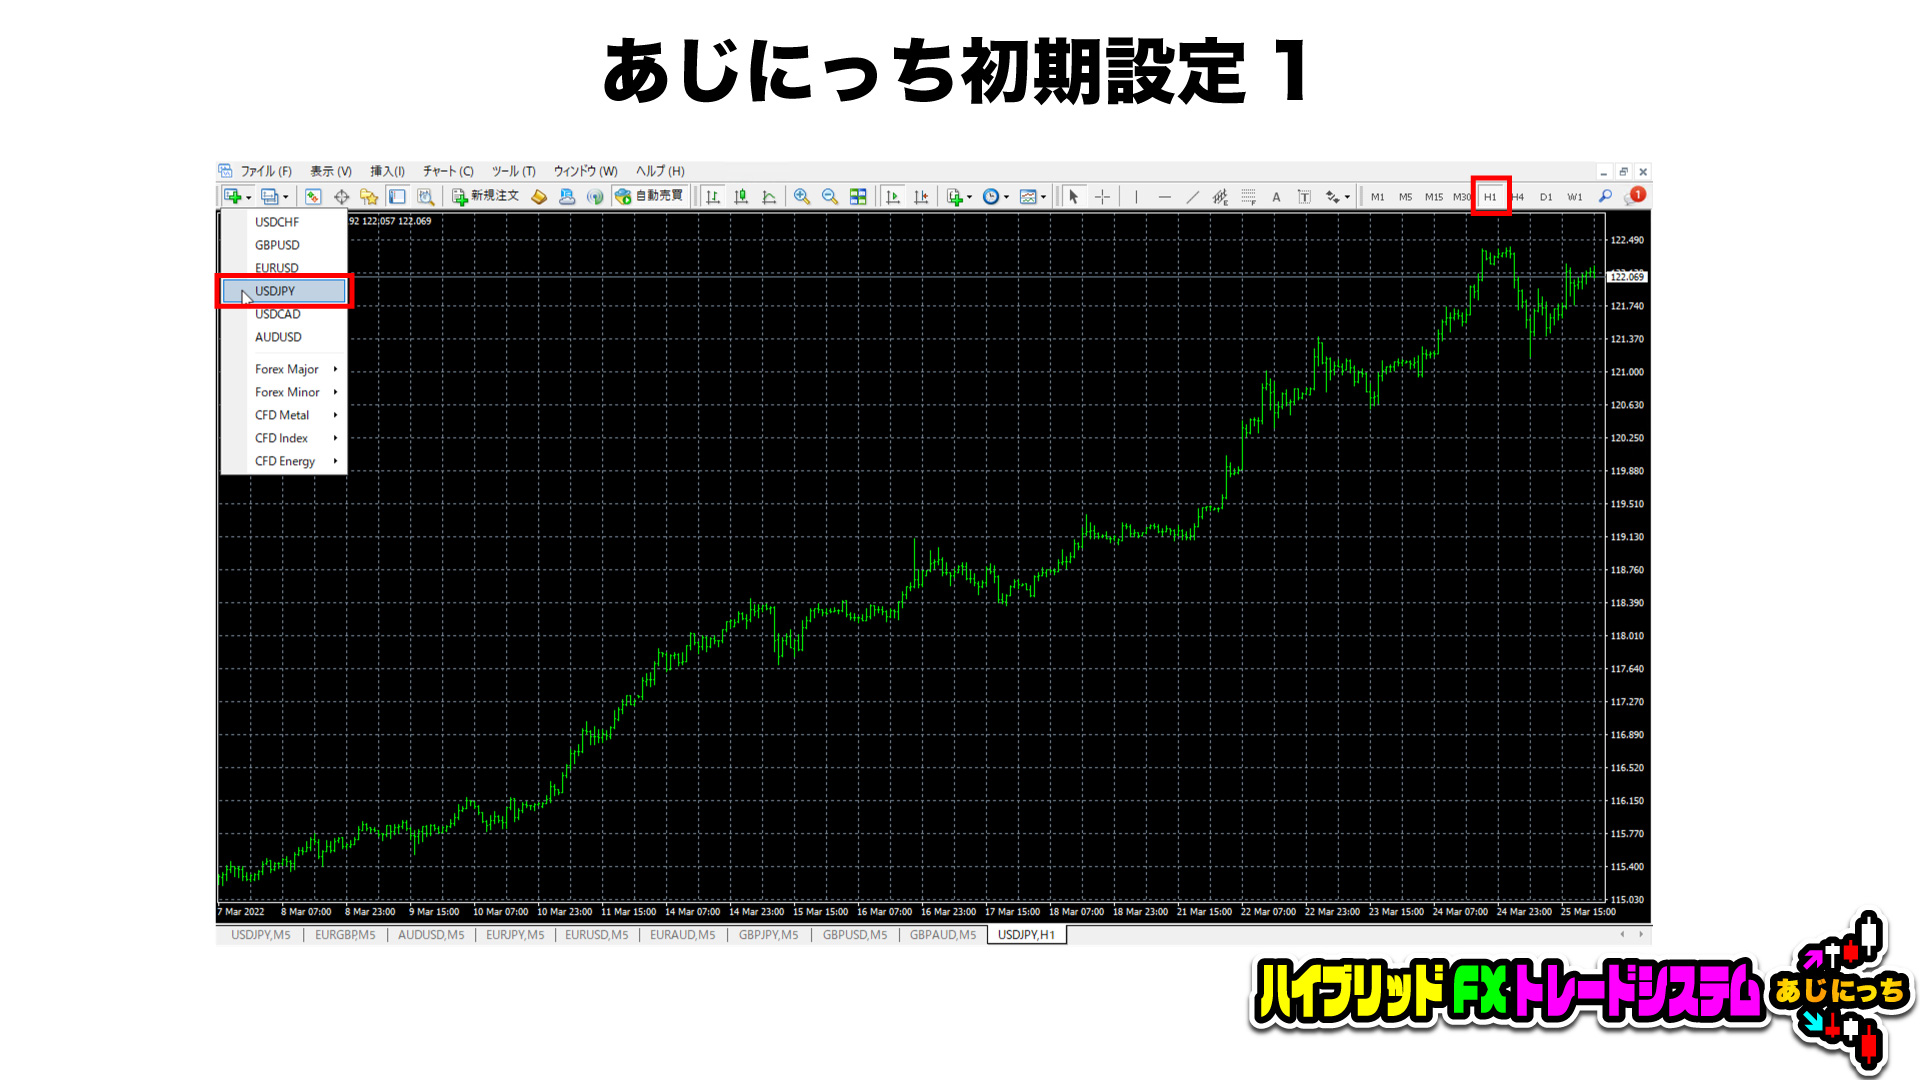
The figure above shows MT4's initial settings with a new USD/JPY chart displayed in the red box at the top left.
The red box at the top right means that the default initial setting displays a 1-hour chart.
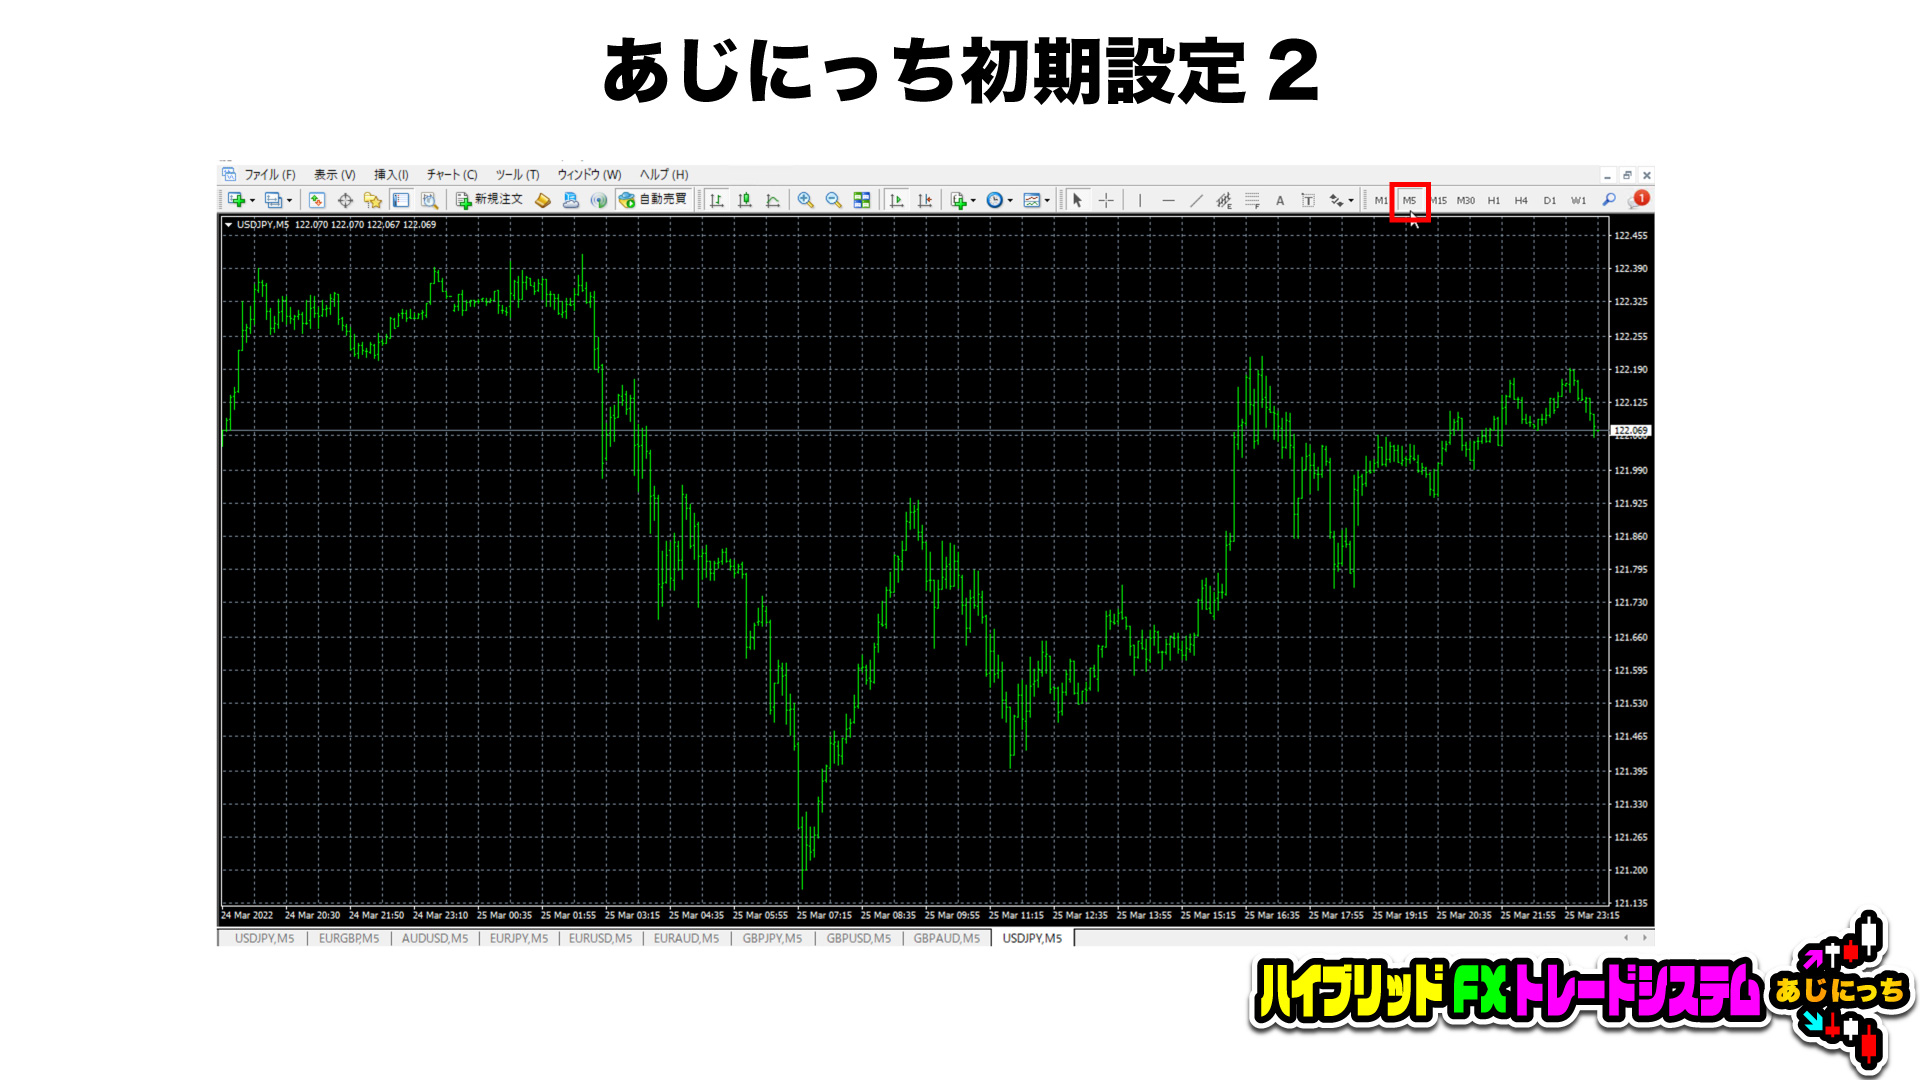
Next, since Ajinitchi only operates on a 5-minute chart, be sure to switch to a 5-minute chart.
Here is the screen after switching to 5 minutes.
Next, install the templates that are distributed for free.
Please obtain the free template distribution here.
The template file is named ajinitchi_EA_Ver1_4.tpl, so place it from MT4's top menu bar: File → Data Folder → MQL4 → templates, then restart.
After restarting, right-click the blank area of the MT4 main chart, select Template → ajinitchi_EA_Ver1_4.
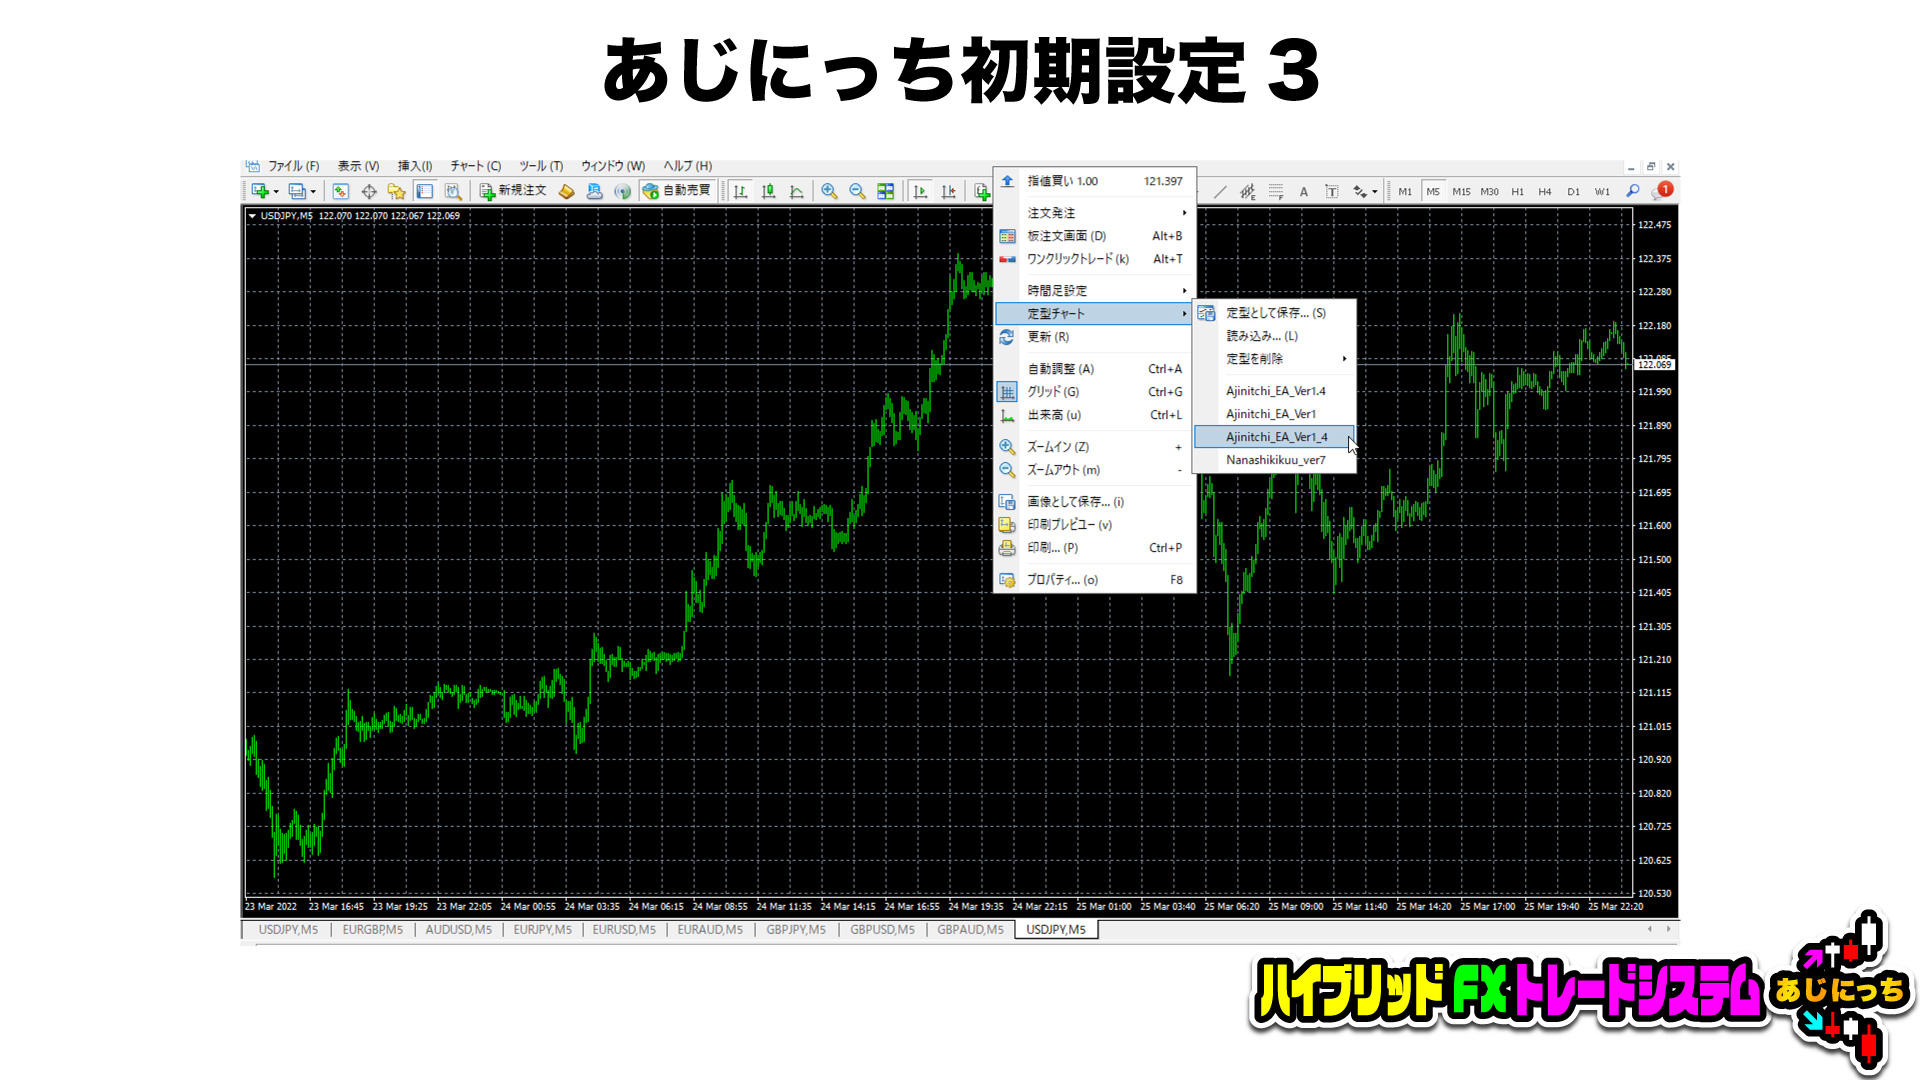
The figure above shows selecting the installed template from the standard chart.
This makes the candlesticks the same size as what I normally view.
That is shown below.
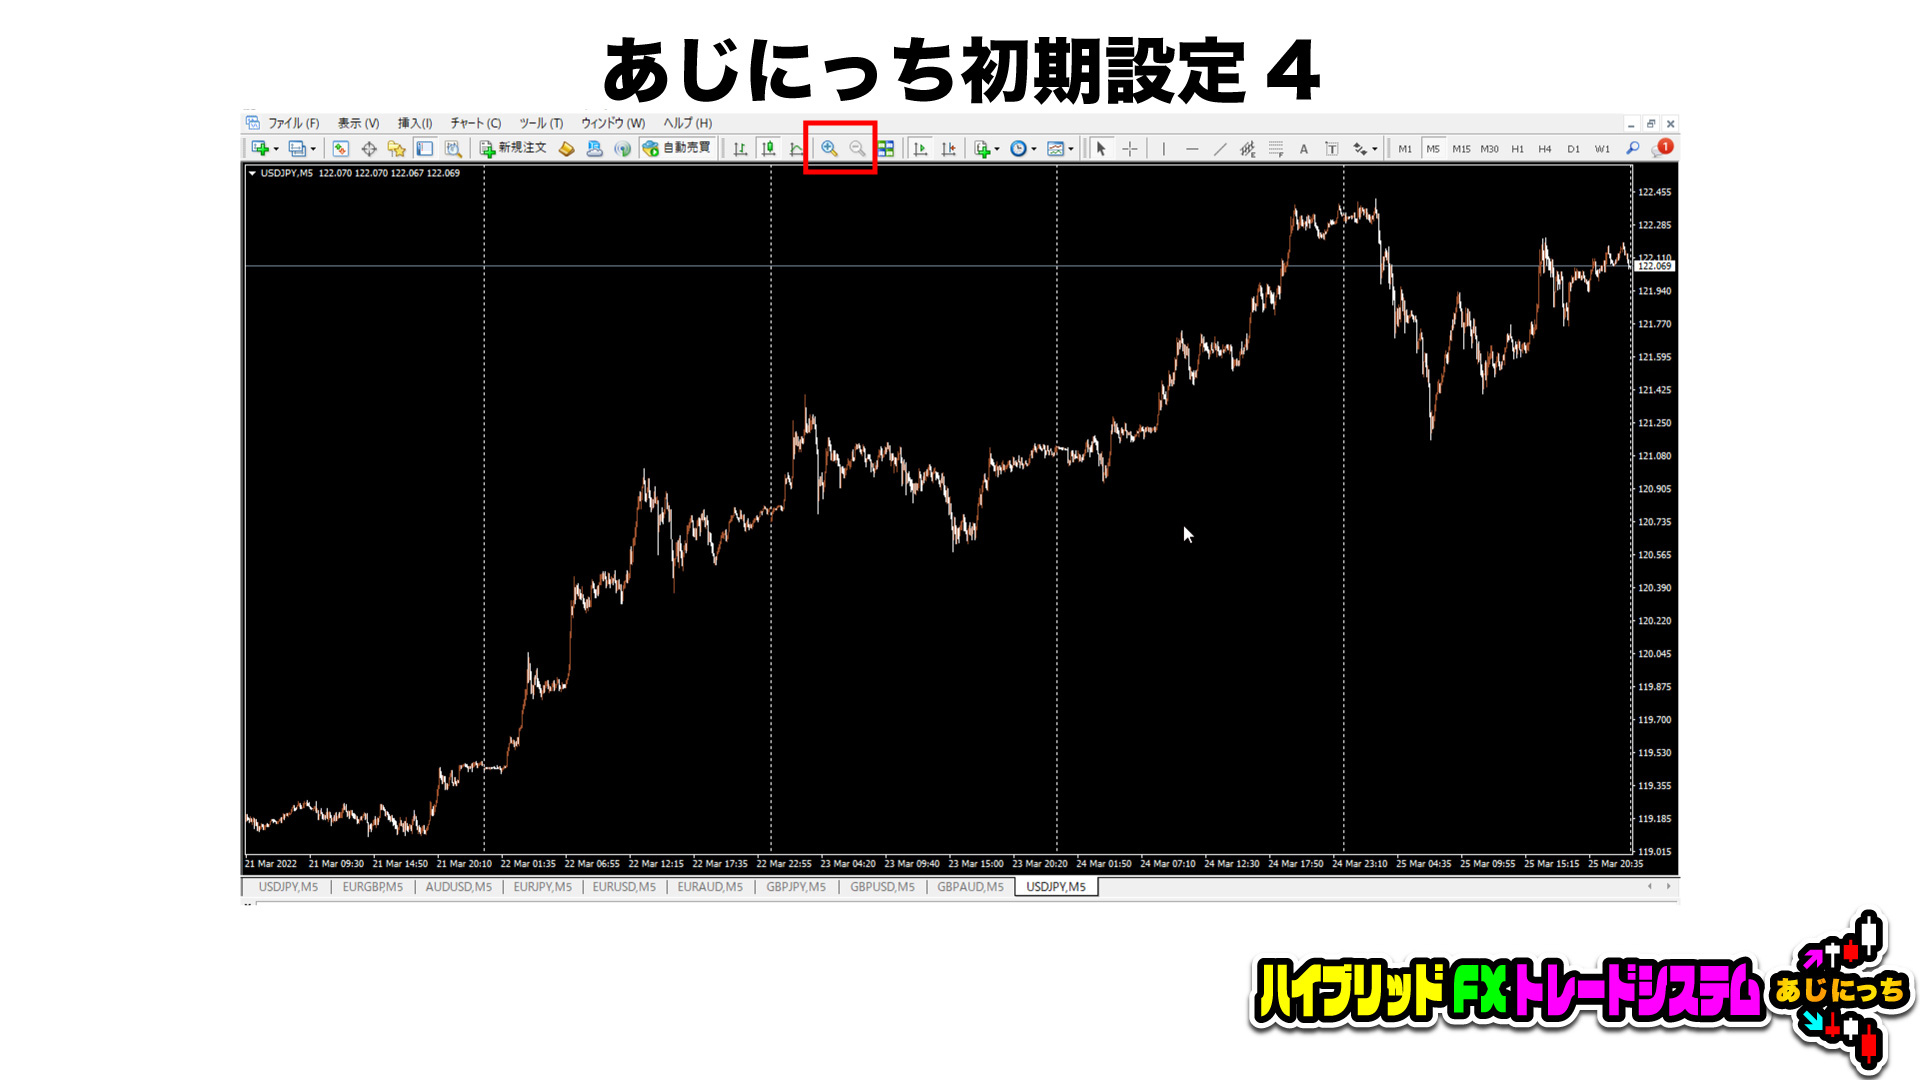
The red-boxed area in the MT4 top menu bar on the right side is gray and disabled, meaning the right side is negative.
This means the candlesticks are at the minimum size.
On the left you can press plus to enlarge, but displaying enlarged candlesticks makes you susceptible to small price movements and you may miss larger trends.
In my 15 years of FX trading, I realized that showing candlesticks too large was one of my failures.
To grasp the larger trend from an overview, smaller candlesticks are better.
If you try to read too much meaning into the wicks, you’ll want to zoom in, but first observe the week's flow from this vantage point.
And then finally apply the indicators.
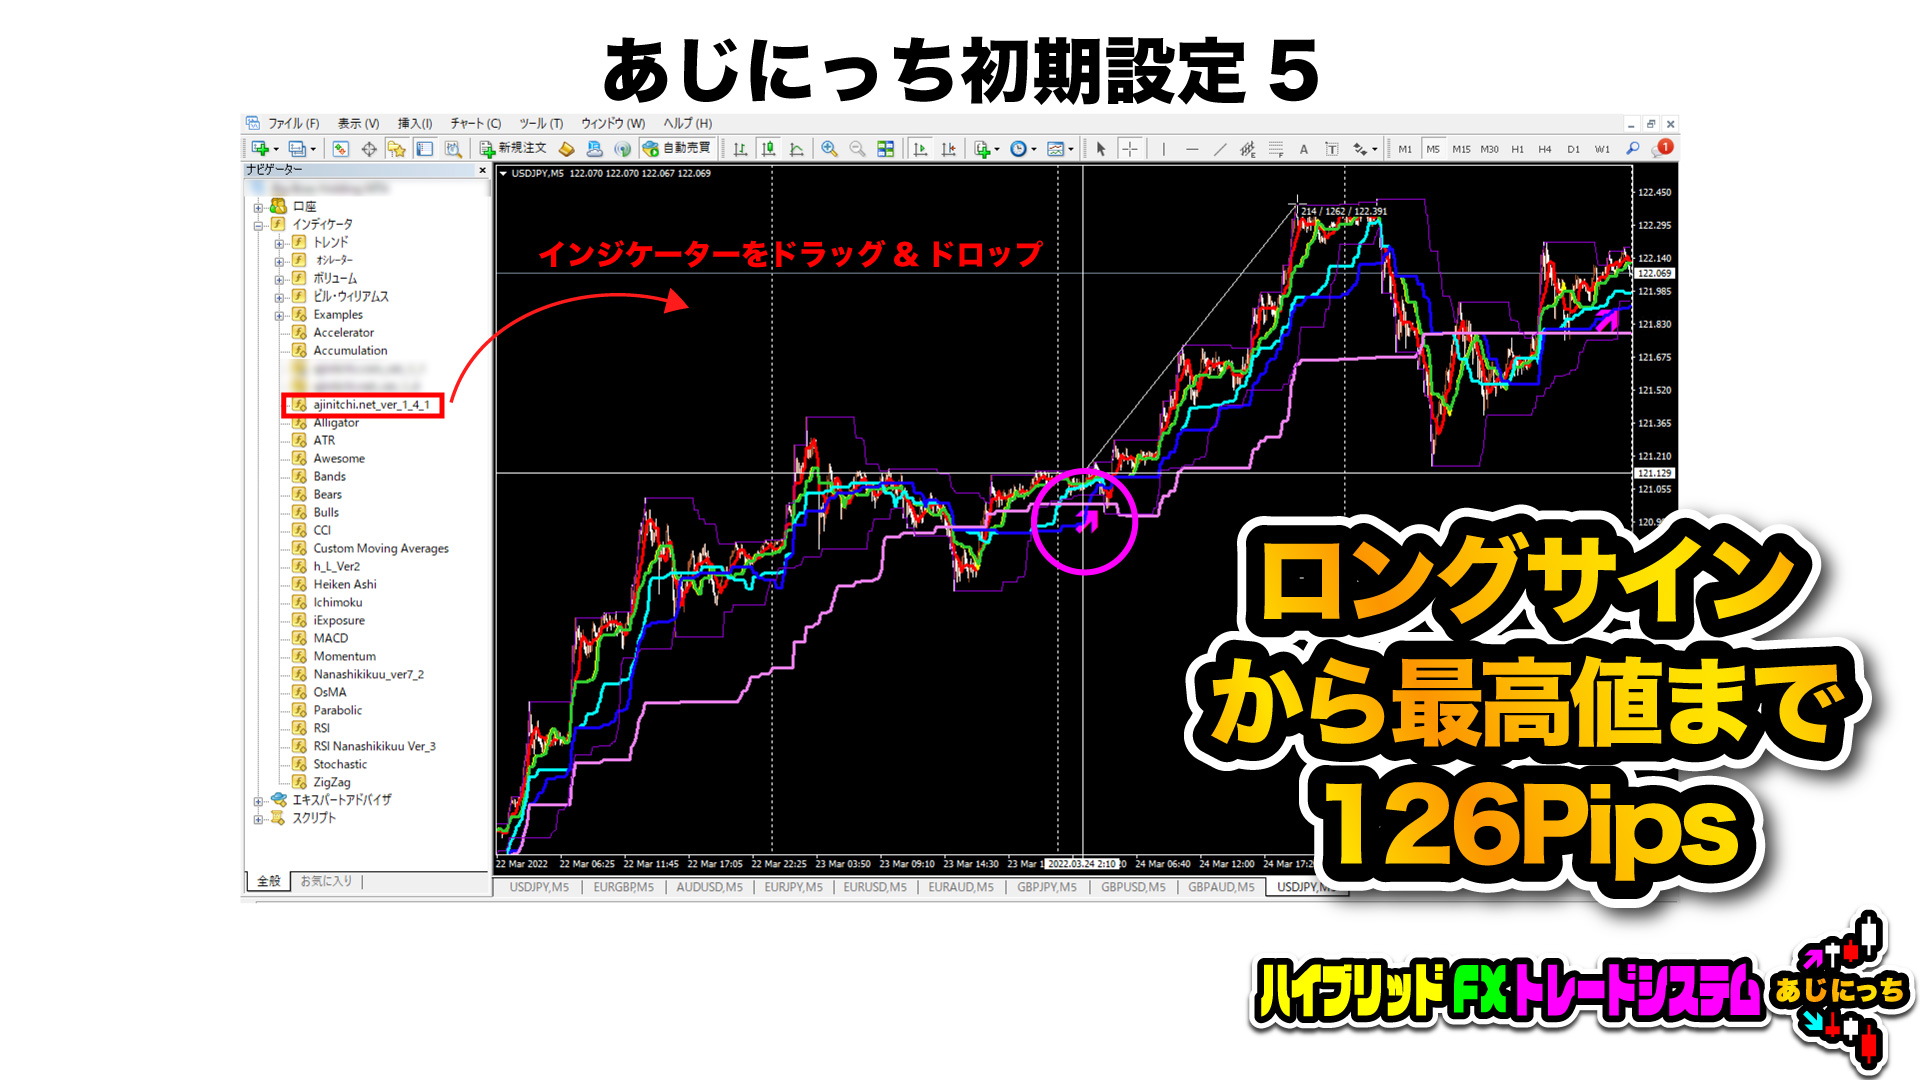
Today is Saturday, March 26, 2022, so this is yesterday’s USD/JPY 5-minute chart.
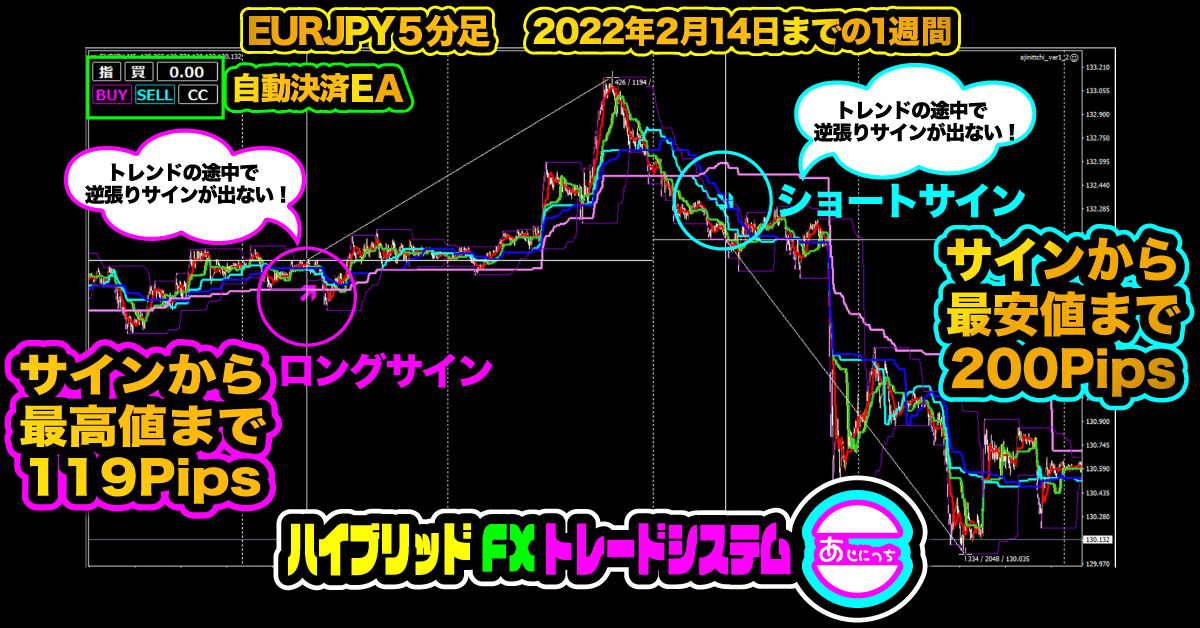
USD/JPY is in a quite large market trend, and from this pullback timing, the distance to the high is 126 pips.
As I have repeated many times, large market moves can begin suddenly and last longer than you expect.
You cannot win in a big move with an indicator that predefines a peak or easily signals selling.
As I wrote in the previous article, the biggest strength of Ajinitchi is that USD/JPY has not shown a selling signal for a month.
Today's chart is for this past week; looking at the chart above, can you draw one candlestick for the week?
There is a large bullish candle.
Let's look at the weekly chart.
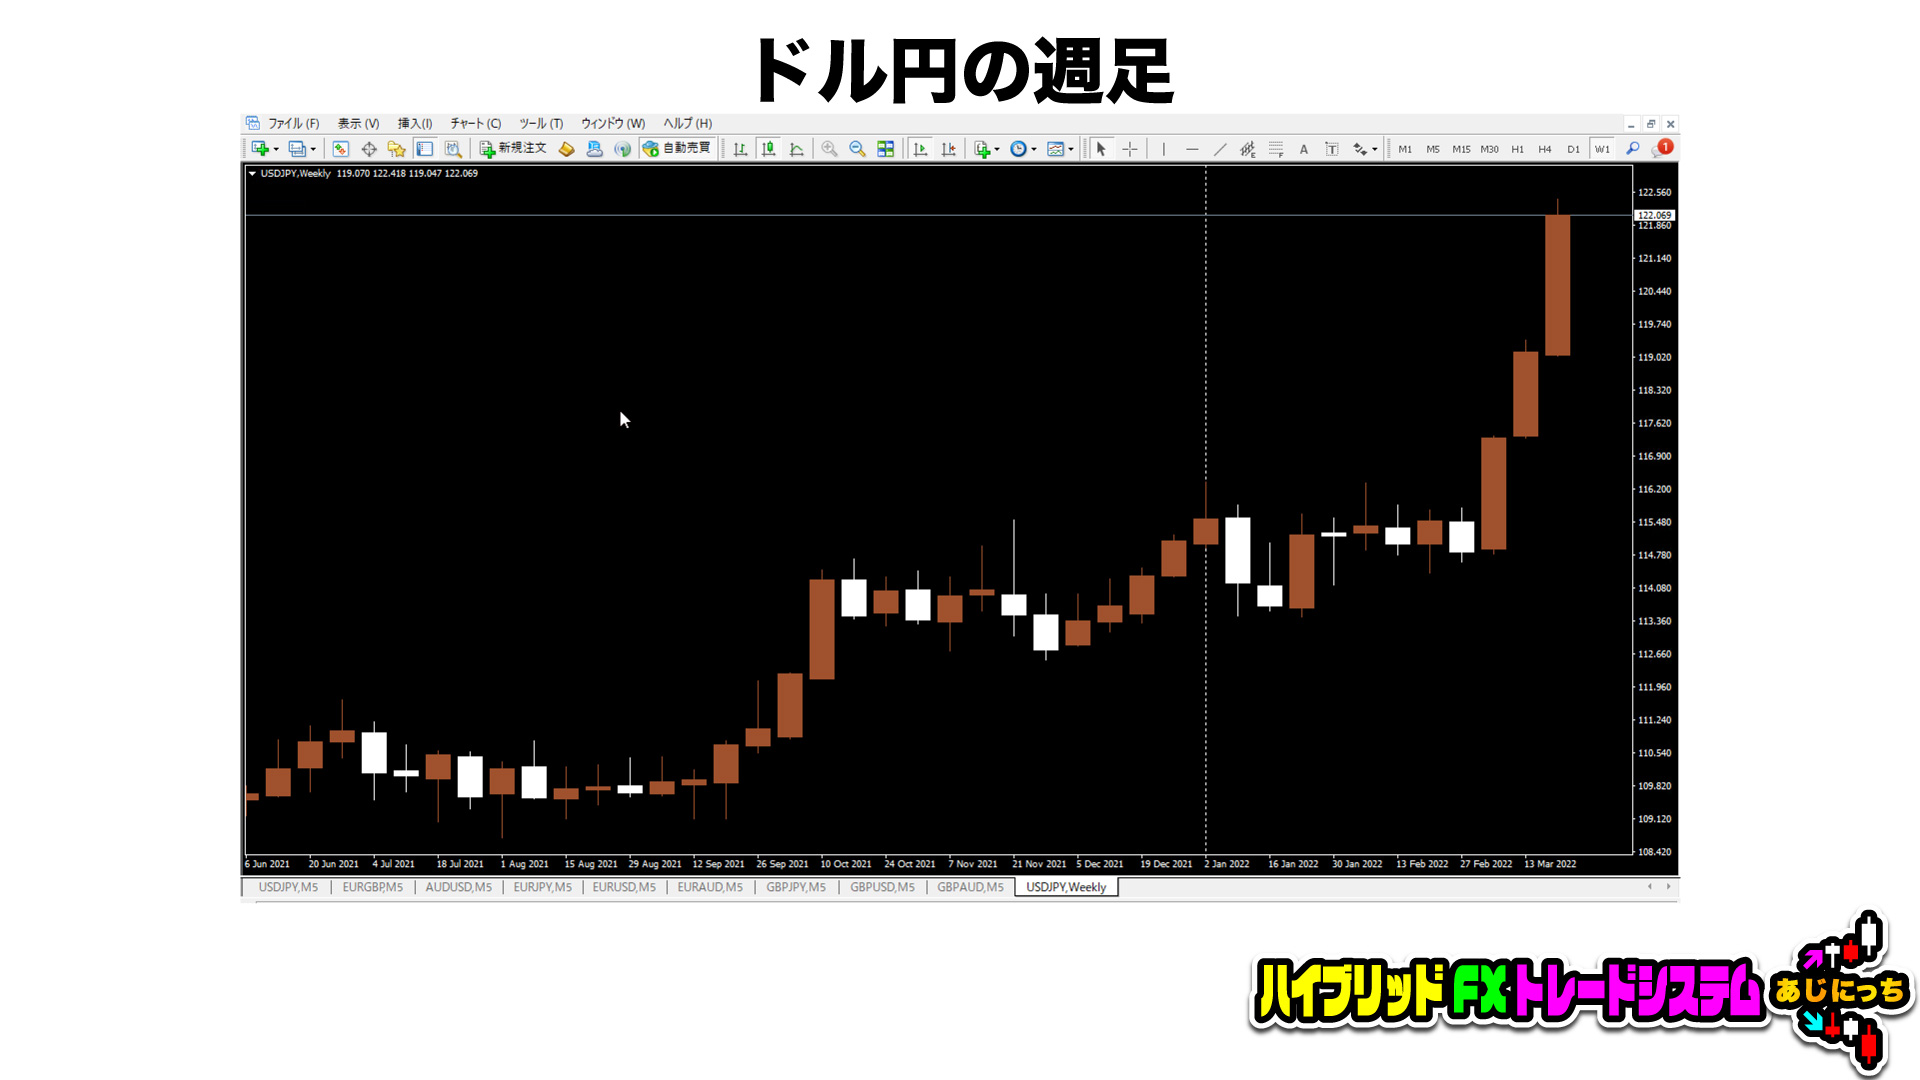
Do you know the term "Three Big Bullish Candles Profit-taking Line" from Sakata Bojoho?
There are three large bullish candles on the weekly chart, so for those holding long-term, it could have been a place to take profits.
I do not trade contrarian strategies, but if you test it, this week's highest price might have been a selling point.
Well, however, such fortune-tellers will eventually incur large losses, so for those who are losing, it is fine to forecast, but execute only when the forecast matches the chart pattern and signals.
Back to the templates, shall we?
Using this "Ajinitchi Template" will cultivate hawk-eyed vigilance, making small ups and downs less concerning.
First, aim for that.
Then bravely enter on large trends.
I will write more articles about the detailed "Ajinitchi Method," so please look forward to them.
There are signs even on weekends, but what will happen at the start of the week remains to be seen.
I basically do not trade on Friday nights, and if I do, I exit quickly with scalping.
It may be better not to trade on Monday mornings or Friday nights.
We will continue providing information for purchasers, so thank you for your ongoing support.
As mentioned at the beginning, this article is a subscription service of 2,980 yen that can be viewed free for one month.
We will update articles for free for one month, so I would be grateful if you could learn how to use indicators as much as possible during the free period.
Have a great weekend.
This has been Ku, a part-time trader.