

Contrarian Scenario RSI Bands Summary for the 4-hour and Daily Charts
Hello today!
FX research, this is Satori.
This time, I have summarized the four-hour and daily charts for the contrarian scenario RSI Bands EA and the indicator.
http://fxmt4indicator.abproducts.biz/wp/?page_id=1554
The figure below is a signal example of the USDJPY on the daily chart.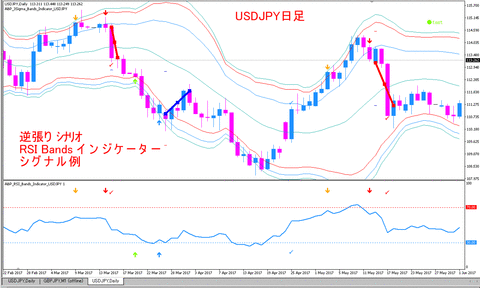
http://livedoor.blogimg.jp/fxmt4indicator/imgs/f/2/f2aec58c.gif
When the Bollinger Band's 3-sigma (actually 1.5–3.0 for each currency, Upper/Lower) is crossed at the close, the contrarian trade setup signal arrows are displayed toward the central moving average line.
For a buying setup, green upward arrows appear; for a selling setup, orange downward arrows appear.
In actual trading, when one sigma (actual currency, Upper/Lower, 0.5–2.0) is crossed at the close, the setup signal arrows are displayed toward the central moving average line.
If it is a buying setup, blue upward arrows; if a selling setup, red downward arrows.
If a setup signal appears at the close, enter at the next opening price.
The figure below shows a report and balance curve when five currencies were operated simultaneously and remained stable for five years on the 4-hour chart.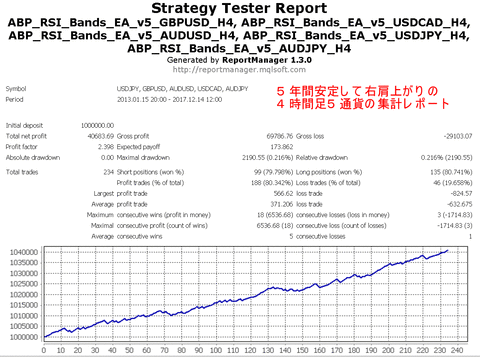
http://livedoor.blogimg.jp/fxmt4indicator/imgs/2/3/23a8326e.gif
The totals in the above figure are as follows.
Period: January 2013 to December 2017
Note: Optimizing including data from 2011 and 2012 at 1 USD 70–80 yen makes performance drop above 100 yen per USD, so totals are for the above period.
Trading unit: 0.01 lots
Net profit: ¥40,683.69
Number of trades: 234
Wins: 188
Losses: 46
Win rate: 80.342%
PF (Profit Factor): 2.398
Maximum drawdown: ¥2,190.55
Average profit per winning trade: ¥371.206
Average loss per losing trade: ¥632.675
The figure below shows a report and balance curve when four currencies were operated simultaneously and remained stable for five years on the daily chart.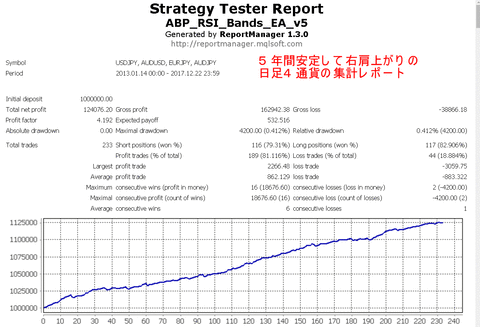
http://livedoor.blogimg.jp/fxmt4indicator/imgs/1/9/190e73e9.gif
The totals in the above figure are as follows.
Period: January 2013 to December 2017
Note: Optimizing including data from 2011 and 2012 at 1 USD 70–80 yen makes performance drop above 100 yen per USD, so totals are for the above period.
Trading unit: 0.01 lots
Net profit: ¥124,076.20
Number of trades: 233
Wins: 189
Losses: 44
Win rate: 81.116%
PF: 4.192
Maximum drawdown: ¥4,200.00
Average profit per winning trade: ¥862.129
Average loss per losing trade: ¥883.322
Compared to the 4-hour chart, the daily chart shows a higher profit factor, right?
The longer the time frame, the more it captures larger trends, certainly.
From the ratio of average profit per winning trade to average loss per losing trade, the 4-hour chart tends to be small-win large-loss, whereas the daily chart is almost the same, with a risk/reward ratio of 1:1, suggesting the daily chart is more stable.
Also, Bollinger Bands tend to function more readily on longer timeframes.
Perhaps because the market-moving human psychology aligns more with daily or weekly cycles than with 1-minute to 1-hour intervals.
In a forthcoming free version update, both EA and indicator will include preset files for the following currencies and timeframes.
For the 4-hour and daily charts
AUDJPY
AUDUSD
EURJPY
EURUSD
GBPJPY
GBPUSD
USDCAD
USDJPY
Preset files can be loaded by clicking “Load” in the Parameters tab of the EA or Indicator settings screen.
In this version, the EA is provided as a single file, and the indicators are provided as two files: one for Bollinger Bands and one for RSI, so please load the preset files for each currency and timeframe.
We have test reports and presets for each currency and timeframe, making it easy to select a favorite and operate.
This time, the contrarian scenario RSI Bands Indicator and EA were used for verification
http://fxmt4indicator.abproducts.biz/wp/?page_id=1554
Technical Trade Blog Ranking
Please also register for the free newsletter “FX Research” at the URL below.


